
部分加水分解グアーガムの市場機会、成長促進要因、産業動向分析、2025年~2034年予測
Partially Hydrolyzed Guar Gum Market Opportunity, Growth Drivers, Industry Trend Analysis, and Forecast 2025 - 2034- 発行日
- ページ情報
- 英文 263 Pages
- 納期
- 2~3営業日
- 商品コード
- 1755257
- カスタマイズ可能 お客様のご希望に応じて、既存データの加工や未掲載情報(例:国別セグメント)の追加などの対応が可能です。詳細はお問い合わせください。
- 翻訳ツール提供対象 PDF対応AI翻訳ツールの無料貸し出しサービスのご利用が可能です
概要
部分加水分解グアーガムの世界市場は、2024年に2億5,110万米ドルと評価され、消化器系健康製品、クリーンラベル栄養、プレバイオティクス強化食品に対する世界の需要の急増に牽引され、CAGR6%で成長し、2034年までには4億4,750万米ドルに達すると推定されています。
PHGGは酵素による加水分解を受けるため、低粘度の水溶性食物繊維として様々な用途に理想的です。PHGGは様々なpHレベルと温度で安定性を維持し、機能性食品、飲料、栄養補助食品を含む多様な食品システムに適合します。植物由来でアレルゲンを含まない原料へのシフトが進んでいることも、PHGGを健康志向の消費者向け製品の配合に好ましい成分として位置づけています。
消化器系疾患の緩和を求める消費者は、栄養補助食品におけるPHGGの需要に拍車をかけています。PHGGのプレバイオティクスの利点は、腸内細菌叢のバランスをサポートし、胃腸障害の症状を緩和します。PHGGは、組み込みの容易さと機能的多様性により、ベーカリー製品、植物性代替食品、強化スナック、治療用製剤でますます見られるようになっています。クリーンラベルの魅力、優れた溶解性、マイルドな味を提供するため、食感や風味を損なうことなく毎日の食物繊維摂取量を増やしたいと考える健康志向の消費者にとって理想的です。
| 市場範囲 | |
|---|---|
| 開始年 | 2024年 |
| 予測年 | 2025年~2034年 |
| 開始金額 | 2億5,110万米ドル |
| 予測金額 | 4億4,750万米ドル |
| CAGR | 6% |
食品用セグメントは2024年に1億2,500万米ドルを生み出しました。このセグメントは、PHGGの溶解性と健康増進の特質により、日常食品に幅広く使用されていることから利益を得ています。風味や食感を損なうことなく機能性食物繊維を供給できるPHGGの能力が、食物繊維を強化した飲料、シリアル、ミールバーへの統合を後押ししています。満腹感と消化の快適さを促進するPHGGの役割は、クリーンラベルで健康志向の製品を求める消費者にとって理想的です。
医薬品分野は2024年に7,090万米ドルを生み出し、2034年には1億1,640万米ドルに達すると予測されています。PHGGは、IBSや便秘などの消化器系疾患を管理する臨床栄養学でよく認知されています。PHGGは粘度が低く、幅広い年齢層に耐性があるため、長期的な食事サポートに適しています。PHGGの有効性が臨床データでますます確認されるにつれて、PHGGは大腸の健康のためのサプリメントや、食物繊維を用いた治療的介入において、特に世界中の老人や健康志向の高い人々に広く利用されるようになってきています。
米国の部分加水分解グアーガム市場は2024年に5,550万米ドルとなり、食品および製薬セクターからの大きな牽引力が見られます。使用事例は、治療食用途、医療栄養、さらにはペットケアやパーソナルケアのカテゴリーに至るまで急速に拡大しており、特に高齢化が進む人々の間で需要が高まっています。消化器系の健康をサポートし、血糖値反応を管理し、体重コントロールのポジションを補助するこの成分の能力は、健康志向の製品開発における機能的定番となっています。製剤メーカーはまた、サプリメント、臨床栄養処方、老人の食事ニーズとの適合性を求めてPHGGを探求しています。
部分加水分解グアーガム市場の主な市場企業には、BASF SE、Ingredion Incorporated(およびその子会社Tic Gums, Inc)、CP Kelco U.S.、Ashland Global Holdings Inc.、Cargill, Incorporatedなどがあります。これらの企業は市場の革新と拡大に積極的に貢献しています。部分加水分解グアーガム分野の主要企業は、医薬品、機能性食品、クリーンラベルの用途に合わせた特殊なPHGGを開発するため、研究開発に多額の投資を行っています。多くの企業は、特に北米とアジアにおける世界の需要の増加に対応するため、生産能力を拡大しています。食品メーカーや栄養補助食品メーカーとの戦略的提携は、企業が流通網を広げるのに役立っています。規制当局の承認と臨床的検証もまた、市場参入と信頼性の鍵であり、企業は科学的研究と安全性認証を優先するよう促されています。
目次
第1章 調査手法と範囲
第2章 エグゼクティブサマリー
第3章 業界考察
- 市場イントロダクション
- 業界バリューチェーン分析
- 製品概要
- Phgg:定義と構成
- 製造プロセスと酵素加水分解
- 物理化学的性質
- 栄養成分と健康効果
- プレバイオティクスの特性と腸の健康への影響
- 天然グアーガムとの比較
- 他の食物繊維との比較
- 市場力学
- 市場促進要因
- 消化器系の健康とプレバイオティクスの需要の高まり
- 機能性食品と栄養補助食品の成長
- クリーンラベルと植物由来の原料の好み
- 市場促進要因
- 市場抑制要因
- 高い生産・加工コスト
- 新興市場における消費者の認知度の低さ
- 地域間の規制の複雑さ
- 市場機会
- 腸内環境機能成分の需要増加
- 栄養補助食品と食品分野での応用拡大
- 低FODMAP食物繊維への関心の高まり
- 業界への影響要因
- 成長可能性分析
- 業界の潜在的リスク・課題
- 規制の枠組みと基準
- 食品添加物規制
- 食物繊維の定義
- 健康強調表示規制
- 品質と安全基準
- オーガニック・非遺伝子組み換え認証
- 製造プロセス分析
- グアーガム抽出
- 酵素加水分解プロセス
- 精製技術
- 乾燥と粉砕
- 品質管理手順
- 原材料分析と調達戦略
- 価格分析
- 持続可能性と環境影響評価
- PESTEL分析
- ポーターのファイブフォース分析
- 貿易分析:輸出入シナリオ
- トランプ政権の関税分析
- 貿易への影響
- 貿易量の混乱
- 報復措置
- 業界への影響
- 供給側の影響(原材料)
- 主要原材料の価格変動
- サプライチェーンの再構築
- 生産コストへの影響
- 需要側の影響(販売価格)
- 最終市場への価格伝達
- 市場シェアの動向
- 消費者の反応パターン
- 影響を受ける主要企業
- 戦略的な業界対応
- サプライチェーンの再構成
- 価格設定と製品戦略
- 政策関与
- 貿易統計(HSコード)
- 主要輸出国、2021年~2024年
- 米国
- 日本
- 韓国
- 主要輸入国、2021年~2024年
- インド
- ロシア
- 米国
- 主要輸出国、2021年~2024年
- 供給側の影響(原材料)
- 貿易への影響
注:上記の貿易統計は主要国についてのみ提供されます
第4章 競合情勢
- 市場シェア分析
- 戦略枠組み
- 合併と買収
- ジョイントベンチャーとコラボレーション
- 新製品開発
- 拡大戦略
- 競合ベンチマーキング
- ベンダー情勢
- 競合ポジショニングマトリックス
- 戦略的ダッシュボード
- 特許分析とイノベーション評価
- 新規参入者の市場参入戦略
- 配電網分析
第5章 市場推計・予測:グレード別、2021年~2034年
- 主要動向
- 食品グレード
- 標準
- プレミアム
- 医薬品
- 産業
- その他
第6章 市場推計・予測:形態別、2021年~2034年
- 主要動向
- 粉末
- 細粒
- 粗粒
- 顆粒
- その他
第7章 市場推計・予測:製造方法別、2021年~2034年
- 主要動向
- 酵素加水分解
- バッチ
- 常用
- 化学的加水分解
- その他の生産
第8章 市場推計・予測:用途別、2021年~2034年
- 主要動向
- 食品・ベーカリー
- ベーカリー・菓子類
- 乳製品・冷凍デザート
- 飲料
- 朝食用シリアル・バー
- ソース、ドレッシング、調味料
- 肉・鶏肉製品
- その他の食品用途
- 栄養補助食品
- 食物繊維サプリメント
- 体重管理サプリメント
- 消化器系の健康サプリメント
- その他のサプリメントタイプ
- 医薬品
- 固形剤形
- 液体製剤
- その他の医薬品用途
- パーソナルケア・化粧品
- 動物飼料
- その他の用途
第9章 市場推計・予測:機能別、2021年~2034年
- 主要動向
- 食物繊維の強化
- プレバイオティクス効果
- テクスチャの変更
- 安定
- 増粘
- 脂肪置換
- その他の機能
第10章 市場推計・予測:最終用途別、2021年~2034年
- 主要動向
- 食品・飲料業界
- 大手食品メーカー
- 中型・小型フードプロセッサー
- 専門食品メーカー
- 栄養補助食品業界
- 製薬業界
- 大手製薬会社
- ジェネリック医薬品メーカー
- 契約製造組織(CMOS)
- パーソナルケア業界
- 動物飼料産業
- その他の最終用途産業
第11章 市場推計・予測:流通チャネル別、2021年~2034年
- 主要動向
- 直接販売
- 販売代理店・卸売業者
- オンラインチャネル
- その他
第12章 市場推計・予測:地域別、2021年~2034年
- 主要動向
- 北米
- 米国
- カナダ
- 欧州
- ドイツ
- 英国
- フランス
- スペイン
- イタリア
- ロシア
- その他欧州地域
- アジア太平洋
- 中国
- インド
- 日本
- オーストラリア
- 韓国
- その他アジア太平洋
- ラテンアメリカ
- ブラジル
- メキシコ
- アルゼンチン
- その他ラテンアメリカ地域
- 中東・アフリカ
- サウジアラビア
- 南アフリカ
- アラブ首長国連邦
- その他中東・アフリカ地域
第13章 企業プロファイル
- Altrafine Gums
- Ashland Global Holdings Inc.
- BASF SE
- Cargill, Incorporated
- CP Kelco U.S., Inc.
- Dabur India Ltd.
- Deosen Biochemical Ltd.
- DuPont de Nemours, Inc.
- Fufeng Group
- Guangrao Liuhe Chemical Co., Ltd.
- Hindustan Gum &Chemicals Ltd.
- Ingredion Incorporated
- Jingkun Chemistry Company
- Kerry Group plc
- Lonza Group AG
- Lotus Gums &Chemicals
- Lucid Colloids Ltd.
- Meihua Holdings Group Co., Ltd.
- Neelkanth Polymers
- Nexira
- Polygal AG
- Rama Industries
- Shandong Yuansheng Chemical Co., Ltd.
- Shree Ram Gum Chemicals
- Sunita Hydrocolloids Pvt. Ltd.
- Taiyo International, Inc.
- Tic Gums, Inc.(Ingredion)
- Vikas WSP Limited
- Wuxi Jinxin Science &Technology Co., Ltd.
目次
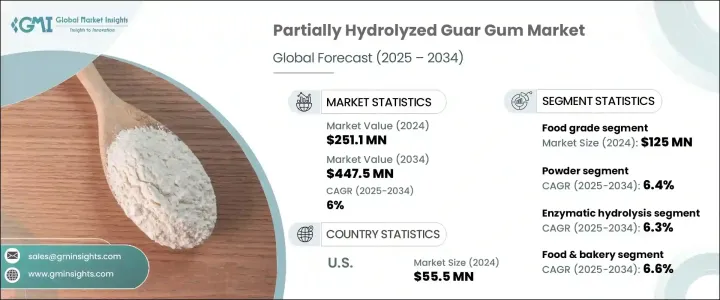
The Global Partially Hydrolyzed Guar Gum Market was valued at USD 251.1 million in 2024 and is estimated to grow at a CAGR of 6% to reach USD 447.5 million by 2034, driven by the global surge in demand for digestive health products, clean-label nutrition, and prebiotic-enriched foods. PHGG undergoes enzymatic hydrolysis, making it a low-viscosity, water-soluble fiber ideal for several applications. It maintains stability across varying pH levels and temperatures, offering compatibility with diverse food systems including functional foods, beverages, and dietary supplements. The increasing shift toward plant-based, allergen-free ingredients has also positioned PHGG as a preferred component in formulating health-focused consumer products.
Consumers seeking digestive relief are fueling the demand for PHGG in nutraceuticals, where its prebiotic benefits support gut microbiota balance and alleviate symptoms of gastrointestinal disorders. The ingredients are increasingly found in bakery goods, plant-based alternatives, fortified snacks, and therapeutic formulations due to ease of incorporation and functional versatility. It offers clean-label appeal, excellent solubility, and a mild taste, making it ideal for health-conscious consumers looking to boost daily fiber intake without compromising texture or flavor.
| Market Scope | |
|---|---|
| Start Year | 2024 |
| Forecast Year | 2025-2034 |
| Start Value | $251.1 Million |
| Forecast Value | $447.5 Million |
| CAGR | 6% |
The food-grade segment generated USD 125 million in 2024. This segment benefits from the broad usage of PHGG in everyday food items due to its solubility and health-promoting qualities. PHGG's ability to deliver functional fiber without compromising flavor or texture has driven its integration into fiber-enriched beverages, cereals, and meal bars. Its role in promoting satiety and digestive comfort makes it ideal for consumers seeking clean-label, wellness-oriented products.
The pharmaceutical segment generated USD 70.9 million in 2024 and is projected to reach USD 116.4 million by 2034. PHGG is well-recognized in clinical nutrition for managing digestive ailments such as IBS and constipation. Its low viscosity and tolerance across age groups make it suitable for long-term dietary support. As clinical data increasingly affirms its efficacy, PHGG is finding wider use in colon health supplements and therapeutic fiber-based interventions, especially in geriatric and health-conscious populations worldwide.
United States Partially Hydrolyzed Guar Gum Market generated USD 55.5 million in 2024 witnessing substantial traction from the food and pharma sectors. Use cases are expanding rapidly across therapeutic dietary applications, medical nutrition, and even pet and personal care categories, with demand rising especially among aging populations. The ingredient's ability to support digestive health, manage glycemic response, and aid in weight control positions are a functional staple in health-focused product development. Formulators are also exploring PHGG for its compatibility with supplements, clinical nutrition formulas, and geriatric dietary needs.
Key market players in the Partially Hydrolyzed Guar Gum Market include BASF SE, Ingredion Incorporated (and its subsidiary Tic Gums, Inc.), CP Kelco U.S., Inc., Ashland Global Holdings Inc., and Cargill, Incorporated. These companies are actively contributing to market innovation and expansion. Strategic focus, leading companies in the partially hydrolyzed guar gum space are investing heavily in R&D to develop specialized PHGG variants tailored for pharmaceutical, functional food, and clean-label applications. Many players are expanding their production capacities to meet growing global demand, especially in North America and Asia. Strategic collaborations with food and nutraceutical manufacturers are helping firms broaden their distribution networks. Regulatory approvals and clinical validation are also key to market entry and credibility, prompting companies to prioritize scientific studies and safety certifications.
Table of Contents
Chapter 1 Methodology and Scope
- 1.1 Research methodology
- 1.2 Research scope & assumptions
- 1.3 List of data sources
- 1.4 Market estimation technique
- 1.5 Market segmentation & breakdown
- 1.6 Research limitations
Chapter 2 Executive Summary
- 2.1 Market snapshot
- 2.2 Segment highlights
- 2.3 Competitive landscape snapshot
- 2.4 Regional market outlook
- 2.5 Key market trends
- 2.6 Future market outlook
Chapter 3 Industry Insights
- 3.1 Market introduction
- 3.2 Industry value chain analysis
- 3.3 Product overview
- 3.3.1 Phgg: definition & composition
- 3.3.2 Production process & enzymatic hydrolysis
- 3.3.3 Physicochemical properties
- 3.3.4 Nutritional profile & health benefits
- 3.3.5 Prebiotic properties & gut health effects
- 3.3.6 Comparison with native guar gum
- 3.3.7 Comparison with other dietary fibers
- 3.4 Market dynamics
- 3.4.1 Market drivers
- 3.4.1.1 Rising demand for digestive health and prebiotics
- 3.4.1.2 Growth in functional foods and nutraceuticals
- 3.4.1.3 Clean-label and plant-based ingredient preferences
- 3.4.1 Market drivers
- 3.5 Market restraints
- 3.5.1.1 High production and processing costs
- 3.5.1.2 Limited consumer awareness in emerging markets
- 3.5.1.3 Regulatory complexity across regions
- 3.6 Market opportunities
- 3.6.1.1 Rising demand for gut health functional ingredients
- 3.6.1.2 Expanding applications in nutraceutical and food sectors
- 3.6.1.3 Growing interest in low-fodmap dietary fibers
- 3.7 Industry impact forces
- 3.7.1 Growth potential analysis
- 3.7.2 Industry pitfalls & challenges
- 3.8 Regulatory framework & standards
- 3.8.1 Food additive regulations
- 3.8.2 Dietary fiber definitions
- 3.8.3 Health claim regulations
- 3.8.4 Quality & safety standards
- 3.8.5 Organic & non-gmo certifications
- 3.9 Manufacturing process analysis
- 3.9.1 Guar gum extraction
- 3.9.2 Enzymatic hydrolysis process
- 3.9.3 Purification techniques
- 3.9.4 Drying & milling
- 3.9.5 Quality control procedures
- 3.10 Raw material analysis & procurement strategies
- 3.11 Pricing analysis
- 3.12 Sustainability & environmental impact assessment
- 3.13 Pestle analysis
- 3.14 Porter's five forces analysis
- 3.15 Trade analysis: import-export scenario
- 3.16 Trump administration tariff analysis
- 3.16.1 Impact on trade
- 3.16.1.1 Trade volume disruptions
- 3.16.1.2 Retaliatory measures
- 3.16.2 Impact on the industry
- 3.16.2.1 Supply-side impact (raw materials)
- 3.16.2.1.1 Price volatility in key materials
- 3.16.2.1.2 Supply chain restructuring
- 3.16.2.1.3 Production cost implications
- 3.16.2.2 Demand-side impact (selling price)
- 3.16.2.2.1 Price transmission to end markets
- 3.16.2.2.2 Market share dynamics
- 3.16.2.2.3 Consumer response patterns
- 3.16.2.3 Key companies impacted
- 3.16.2.4 Strategic industry responses
- 3.16.2.5 Supply chain reconfiguration
- 3.16.2.6 Pricing and product strategies
- 3.16.2.7 Policy engagement
- 3.16.2.8 Trade statistics (hs code)
- 3.16.2.8.1 Major exporting countries, 2021-2024 (USD BN)
- 3.16.2.8.1.1 U.S.
- 3.16.2.8.1.2 Japan
- 3.16.2.8.1.3 South Korea
- 3.16.2.8.2 Major importing countries, 2021-2024 (USD BN)
- 3.16.2.8.2.1 India
- 3.16.2.8.2.2 Russia
- 3.16.2.8.2.3 U.S.
- 3.16.2.8.1 Major exporting countries, 2021-2024 (USD BN)
- 3.16.2.1 Supply-side impact (raw materials)
- 3.16.1 Impact on trade
Note: the above trade statistics will be provided for key countries only.
Chapter 4 Competitive Landscape, 2024
- 4.1 Market share analysis
- 4.2 Strategic framework
- 4.2.1 Mergers & acquisitions
- 4.2.2 Joint ventures & collaborations
- 4.2.3 New product developments
- 4.2.4 Expansion strategies
- 4.3 Competitive benchmarking
- 4.4 Vendor landscape
- 4.5 Competitive positioning matrix
- 4.6 Strategic dashboard
- 4.7 Patent analysis & innovation assessment
- 4.8 Market entry strategies for new players
- 4.9 Distribution network analysis
Chapter 5 Market Estimates and Forecast, By Grade, 2021 - 2034 (USD Million) (Kilo Tons)
- 5.1 Key trends
- 5.2 Food grade
- 5.2.1 Standard
- 5.2.2 Premium
- 5.3 Pharmaceutical
- 5.4 Industrial
- 5.5 Other
Chapter 6 Market Estimates and Forecast, By Form 2021 - 2034 (USD Million) (Kilo Tons)
- 6.1 Key trends
- 6.2 Powder
- 6.2.1 Fine
- 6.2.2 Coarse
- 6.3 Granules
- 6.4 Others
Chapter 7 Market Estimates and Forecast, By Production Method, 2021 - 2034 (USD Million) (Kilo Tons)
- 7.1 Key trends
- 7.2 Enzymatic hydrolysis
- 7.2.1 Batch
- 7.2.2 Continuous
- 7.3 Chemical hydrolysis
- 7.4 Other production
Chapter 8 Market Estimates and Forecast, By Application 2021 - 2034 (USD Million) (Kilo Tons)
- 8.1 Key trends
- 8.2 Food & bakery
- 8.2.1 Bakery & confectionery
- 8.2.2 Dairy & frozen desserts
- 8.2.3 Beverages
- 8.2.4 Breakfast cereals & bars
- 8.2.5 Sauces, dressings and condiments
- 8.2.6 Meat & poultry product
- 8.2.7 Other food applications
- 8.3 Dietery supplement
- 8.3.1 Fiber supplements
- 8.3.2 Weight management supplements
- 8.3.3 Digestive health supplements
- 8.3.4 Other supplement types
- 8.4 Pharmaceuticals
- 8.4.1 Solid dosage forms
- 8.4.2 Liquid formulations
- 8.4.3 Other pharmaceuticals application
- 8.5 Personal care & cosmetics
- 8.6 Animal feed
- 8.7 Other applications
Chapter 9 Market Estimates and Forecast, By Functionality, 2021 - 2034 (USD Million) (Kilo Tons)
- 9.1 Key trends
- 9.2 Dietary fiber enrichment
- 9.3 Prebiotic effect
- 9.4 Texture modification
- 9.5 Stabilization
- 9.6 Thickening
- 9.7 Fat replacement
- 9.8 Other functionalities
Chapter 10 Market Estimates and Forecast, By End Use, 2021 - 2034 (USD Million) (Kilo Tons)
- 10.1 Key trends
- 10.2 Food & beverage industry
- 10.2.1 Large food manufacturers
- 10.2.2 Medium & small food processors
- 10.2.3 Specialty food producers
- 10.3 Nutraceutical industry
- 10.4 Pharmaceutical industry
- 10.4.1 Large pharmaceutical companies
- 10.4.2 Generic drug manufacturers
- 10.4.3 Contract manufacturing organizations (cmos)
- 10.5 Personal care industry
- 10.6 Animal feed industry
- 10.7 Other end-use industries
Chapter 11 Market Estimates and Forecast, By Distribution Channel, 2021 - 2034 (USD Million) (Kilo Tons)
- 11.1 Key trends
- 11.2 Direct sales
- 11.3 Distributors & wholesalers
- 11.4 Online channels
- 11.5 Others
Chapter 12 Market Estimates and Forecast, By Region, 2021 - 2034 (USD Million) (Kilo Tons)
- 12.1 Key trends
- 12.2 North America
- 12.2.1 U.S.
- 12.2.2 Canada
- 12.3 Europe
- 12.3.1 Germany
- 12.3.2 UK
- 12.3.3 France
- 12.3.4 Spain
- 12.3.5 Italy
- 12.3.6 Russia
- 12.3.7 Rest of Europe
- 12.4 Asia Pacific
- 12.4.1 China
- 12.4.2 India
- 12.4.3 Japan
- 12.4.4 Australia
- 12.4.5 South Korea
- 12.4.6 Rest of Asia Pacific
- 12.5 Latin America
- 12.5.1 Brazil
- 12.5.2 Mexico
- 12.5.3 Argentina
- 12.5.4 Rest of Latin America
- 12.6 Middle East and Africa
- 12.6.1 Saudi Arabia
- 12.6.2 South Africa
- 12.6.3 UAE
- 12.6.4 Rest of MEA
Chapter 13 Company Profiles
- 13.1 Altrafine Gums
- 13.2 Ashland Global Holdings Inc.
- 13.3 BASF SE
- 13.4 Cargill, Incorporated
- 13.5 CP Kelco U.S., Inc.
- 13.6 Dabur India Ltd.
- 13.7 Deosen Biochemical Ltd.
- 13.8 DuPont de Nemours, Inc.
- 13.9 Fufeng Group
- 13.10 Guangrao Liuhe Chemical Co., Ltd.
- 13.11 Hindustan Gum & Chemicals Ltd.
- 13.12 Ingredion Incorporated
- 13.13 Jingkun Chemistry Company
- 13.14 Kerry Group plc
- 13.15 Lonza Group AG
- 13.16 Lotus Gums & Chemicals
- 13.17 Lucid Colloids Ltd.
- 13.18 Meihua Holdings Group Co., Ltd.
- 13.19 Neelkanth Polymers
- 13.20 Nexira
- 13.21 Polygal AG
- 13.22 Rama Industries
- 13.23 Shandong Yuansheng Chemical Co., Ltd.
- 13.24 Shree Ram Gum Chemicals
- 13.25 Sunita Hydrocolloids Pvt. Ltd.
- 13.26 Taiyo International, Inc.
- 13.27 Tic Gums, Inc. (Ingredion)
- 13.28 Vikas WSP Limited
- 13.29 Wuxi Jinxin Science & Technology Co., Ltd.
- 発行日
- 発行
- Global Market Insights Inc.
- ページ情報
- 英文 263 Pages
- 納期
- 2~3営業日


