
Eガソリンの市場機会、成長促進要因、産業動向分析、2025~2034年予測
E-Gasoline Market Opportunity, Growth Drivers, Industry Trend Analysis, and Forecast 2025 - 2034- 発行日
- ページ情報
- 英文 131 Pages
- 納期
- 2~3営業日
- 商品コード
- 1750603
- カスタマイズ可能 お客様のご希望に応じて、既存データの加工や未掲載情報(例:国別セグメント)の追加などの対応が可能です。詳細はお問い合わせください。
- 翻訳ツール提供対象 PDF対応AI翻訳ツールの無料貸し出しサービスのご利用が可能です
概要
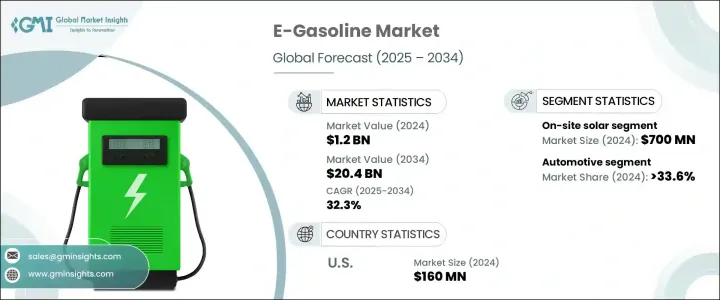
Eガソリンの世界市場規模は、2024年には12億米ドルとなり、今後ますます厳しくなる排出規制とサステイナブル代替燃料への需要の高まりにより、CAGR 32.3%で成長し、2034年には204億米ドルに達すると予測されています。
各国政府がより厳しい環境基準を課す中、産業はよりクリーンな技術を採用し、Eガソリンのようなエコフレンドリーソリューションへの需要を押し上げています。消費者の気候変動に対する意識の高まりと、低炭素燃料に割高な対価を支払う意欲も、この変化を後押ししています。合成燃料であるEガソリンは、従来型化石燃料に代わるよりクリーンな燃料として支持を集めており、輸送をはじめとするさまざまなセグメントで温室効果ガスの排出削減に貢献しています。
新たな技術の進歩により、生産コストの削減と効率の向上が実現し、二酸化炭素排出量の削減を目指す企業や消費者にとって、Eガソリンはより実用的な選択肢となっています。合成燃料の製造方法の開発により、Eガソリンはより効率的に規模を拡大することが可能となり、エネルギー企業からの多額の投資を引き寄せています。自動車産業とエネルギー産業のパートナーシップは、Eガソリンの生産と流通のためのインフラを構築する上で重要な役割を果たしており、Eガソリンの採用と世界の燃料ネットワークへの統合を加速させています。さらに、このような協力関係は、Eガソリン技術の革新を合理化し、この燃料がすぐに入手でき、サステイナブルエネルギー源に対する需要の高まりに対応できるようにするのに役立っています。
| 市場範囲 | |
|---|---|
| 開始年 | 2024年 |
| 予測年 | 2025~2034年 |
| 開始金額 | 12億米ドル |
| 予測金額 | 204億米ドル |
| CAGR | 32.3% |
風力エネルギーセグメントは、政府や企業が大規模な風力タービンの設置に向けた取り組みを強化しており、クリーンで再生可能なエネルギーへの需要が加速していることから、2034年のCAGRは33%と予想され、目覚ましい成長が見込まれています。再生可能エネルギーの導入は現在、気候変動に取り組むための重要な柱とみなされており、風力エネルギーは天然資源を利用して電力を生産する最も効率的な方法のひとつです。タービンの設計と効率の技術的向上により、以前は適地でなかった場所でも、風力発電はより実行可能で費用対効果の高いものとなっています。
2034年のCAGRが32%と予測される海洋セグメントは、より厳しい環境規制を遵守し、温室効果ガス排出量全体の削減に積極的に取り組んでいます。EUのFuelEU Maritime Regulationのようなこれらの規制は、海洋産業が従来型高排出ガス燃料から脱却し、Eガソリン、水素、アンモニアのような代替選択肢にシフトすることを奨励しています。国際海洋は世界の炭素排出の主要原因であるため、低炭素燃料の推進は、特に持続可能性施策が厳しい欧州で勢いを増しています。
欧州のEガソリン市場は2034年までCAGR 30%で成長すると予想され、カーボンニュートラル指令が急速な普及を促進しています。欧州グリーンディールや産業の協力といった主要施策が、自動車や航空を含む様々な輸送手段のサステイナブル燃料への移行を加速させています。EUの2030年再生可能エネルギー目標には、先進バイオ燃料と非生物起源の再生可能燃料(RFNBOs)の大きなシェアが含まれており、この成長はさらに強化されます。
世界のEガソリン市場の主要企業は、Arcadia eFuels、ExxonMobil、Ballard Power Systems、LanzaJetなどです。これらの企業は、市場での地位を強化するために、戦略的パートナーシップ、技術的進歩、生産規模の拡大に注力しています。これらの企業の多くは、Eガソリン生産プロセスの効率と拡大性を向上させるため、研究開発にも多額の投資を行っています。さらに、政府や他の産業リーダーと緊密に協力し、普及を支えるために必要なインフラを確実に整備しています。持続可能性と規制遵守により、これらの企業は、低炭素エネルギーの未来における重要な参入企業としての地位を確立しています。
目次
第1章 調査手法と範囲
第2章 エグゼクティブサマリー
第3章 産業考察
- エコシステム分析
- トランプ政権の関税分析
- 貿易への影響
- 貿易量の混乱
- 報復措置
- 産業への影響
- 供給側の影響(原料)
- 主要原料の価格変動
- サプライチェーンの再構築
- 生産コストへの影響
- 需要側の影響(販売価格)
- 最終市場への価格伝達
- 市場シェアの動向
- 消費者の反応パターン
- 供給側の影響(原料)
- 影響を受ける主要企業
- 戦略的な産業対応
- サプライチェーンの再構成
- 価格設定と製品戦略
- 施策関与
- 貿易への影響
- 展望と今後の検討事項
- 産業への影響要因
- 促進要因
- 産業の潜在的リスク・課題
- 成長可能性分析
- ポーター分析
- PESTEL分析
第4章 競合情勢
- イントロダクション
- 戦略的ダッシュボード
- 戦略的取り組み
- 企業の市場シェア
- 競合ベンチマーキング
- イノベーションと持続可能性の情勢
第5章 市場規模・予測:再生可能エネルギー源別、2021~2034年
- 主要動向
- オンサイト太陽光発電
- 風力
第6章 市場規模・予測:技術別、2021~2034年
- 主要動向
- フィッシャー・トロプシュ
- eRWGS
- その他
第7章 市場規模・予測:用途別、2021~2034年
- 主要動向
- 自動車
- 海洋
- 航空
- 産業
- その他
第8章 市場規模・予測:地域別、2021~2034年
- 主要動向
- 北米
- 米国
- カナダ
- 欧州
- ドイツ
- 英国
- フランス
- スペイン
- オランダ
- アジア太平洋
- 中国
- インド
- 日本
- 韓国
- オーストラリア
- 中東・アフリカ
- サウジアラビア
- アラブ首長国連邦
- 南アフリカ
- ラテンアメリカ
- ブラジル
- アルゼンチン
第9章 企業プロファイル
- Arcadia eFuels
- Archer Daniels Midland Co.
- Ballard Power Systems、Inc.
- Ceres Power Holding Plc
- Climeworks AG
- Clean Fuels Alliance America
- Electrochaea GmbH
- eFuel Pacific Limited
- ExxonMobil
- FuelCell Energy、Inc.
- HIF Global
- INFRA Synthetic Fuels、Inc.
- Liquid Wind
- LanzaJet
- MAN Energy Solutions
- Norsk E-Gasoline AS
- Porsche
- Sunfire GmbH
目次
The Global E-Gasoline Market was valued at USD 1.2 billion in 2024 and is estimated to grow at a CAGR of 32.3% to reach USD 20.4 billion by 2034, driven by increasingly stringent emission regulations and a rising demand for sustainable fuel alternatives. As governments enforce stricter environmental standards, industries adopt cleaner technologies, pushing the demand for eco-friendly solutions like e-gasoline. Consumers' growing awareness of climate change and willingness to pay a premium for low-carbon fuels also support this shift. E-gasoline, as a synthetic fuel, is gaining traction as a cleaner alternative to traditional fossil fuels, aiding in reducing greenhouse gas emissions across various sectors, particularly transportation.
New technological advancements have led to lower production costs and improved efficiency, making e-gasoline a more practical choice for businesses and consumers aiming to lower their carbon footprint. The development of synthetic fuel production methods is enabling e-gasoline to scale more effectively, drawing substantial investments from energy companies. Partnerships between the automotive and energy industries play a key role in building infrastructure for e-gasoline production and distribution, accelerating its adoption and integration into global fuel networks. Additionally, these collaborations help streamline innovation in e-gasoline technology, ensuring that the fuel is readily available and meets the growing demand for sustainable energy sources.
| Market Scope | |
|---|---|
| Start Year | 2024 |
| Forecast Year | 2025-2034 |
| Start Value | $1.2 Billion |
| Forecast Value | $20.4 Billion |
| CAGR | 32.3% |
The wind energy sector is poised for impressive growth, with expectations for a CAGR of 33% by 2034 driven by the accelerating demand for clean, renewable energy, as governments and corporations ramp up efforts to install large-scale wind turbines. Renewable energy adoption is now seen as a key pillar in tackling climate change, and wind energy is one of the most efficient ways to harness natural resources to produce electricity. Technological improvements in turbine design and efficiency make wind power more viable and cost-effective, even in previously unsuitable locations.
The maritime segment, with a projected CAGR of 32% through 2034, is actively working to comply with stricter environmental regulations and reduce its overall greenhouse gas emissions. These regulations, such as the EU's FuelEU Maritime Regulation, encourage the maritime industry to move away from traditional high-emission fuels and shift to alternative options like e-gasoline, hydrogen, and ammonia. As international shipping is a major contributor to global carbon emissions, the push for low-carbon fuels is gaining momentum, particularly in Europe, where sustainability policies are stringent.
Europe E-Gasoline Market is expected to grow at a CAGR of 30% through 2034, with carbon-neutral mandates driving rapid adoption. Key policies like the European Green Deal and industry collaborations are accelerating the transition to sustainable fuels for various transportation modes, including cars and aviation. The EU's binding renewable energy targets for 2030, which include a significant share for advanced biofuels and renewable fuels of non-biological origin (RFNBOs), further reinforce this growth.
Leading players in the Global E-Gasoline Market include Arcadia eFuels, ExxonMobil, Ballard Power Systems, and LanzaJet. These companies are focusing on strategic partnerships, technological advancements, and scaling production to strengthen their position in the market. Many of these players are also investing heavily in R&D to improve the efficiency and scalability of e-gasoline production processes. In addition, they are working closely with governments and other industry leaders to ensure that the necessary infrastructure is in place to support widespread adoption. With sustainability and regulatory compliance, these companies are positioning themselves as key players in a low-carbon energy future.
Table of Contents
Chapter 1 Methodology & Scope
- 1.1 Market definition
- 1.2 Base estimates & calculations
- 1.3 Forecast calculation
- 1.4 Data source
- 1.4.1 Primary
- 1.4.2 Secondary
- 1.4.2.1 Paid
- 1.4.2.2 Public
Chapter 2 Executive Summary
- 2.1 Industry synopsis, 2021 - 2034
Chapter 3 Industry Insights
- 3.1 Industry ecosystem analysis
- 3.2 Trump administration tariffs analysis
- 3.2.1 Impact on trade
- 3.2.1.1 Trade volume disruptions
- 3.2.1.2 Retaliatory measures
- 3.2.2 Impact on the industry
- 3.2.2.1 Supply-side impact (raw materials)
- 3.2.2.1.1 Price volatility in key materials
- 3.2.2.1.2 Supply chain restructuring
- 3.2.2.1.3 Production cost implications
- 3.2.2.2 Demand-side impact (selling price)
- 3.2.2.2.1 Price transmission to end markets
- 3.2.2.2.2 Market share dynamics
- 3.2.2.2.3 Consumer response patterns
- 3.2.2.1 Supply-side impact (raw materials)
- 3.2.3 Key companies impacted
- 3.2.4 Strategic industry responses
- 3.2.4.1 Supply chain reconfiguration
- 3.2.4.2 Pricing and product strategies
- 3.2.4.3 Policy engagement
- 3.2.1 Impact on trade
- 3.3 Outlook and future considerations
- 3.4 Industry impact forces
- 3.4.1 Growth drivers
- 3.4.2 Industry pitfalls & challenges
- 3.5 Growth potential analysis
- 3.6 Porter's analysis
- 3.6.1 Bargaining power of suppliers
- 3.6.2 Bargaining power of buyers
- 3.6.3 Threat of new entrants
- 3.6.4 Threat of substitutes
- 3.7 PESTEL analysis
Chapter 4 Competitive landscape, 2024
- 4.1 Introduction
- 4.2 Strategic dashboard
- 4.3 Strategic initiative
- 4.4 Company market share
- 4.5 Competitive benchmarking
- 4.6 Innovation & sustainability landscape
Chapter 5 Market Size and Forecast, By Renewable Source, 2021 - 2034 (USD Billion)
- 5.1 Key trends
- 5.2 On-site solar
- 5.3 Wind
Chapter 6 Market Size and Forecast, By Technology, 2021 - 2034 (USD Billion)
- 6.1 Key trends
- 6.2 Fischer-tropsch
- 6.3 eRWGS
- 6.4 Others
Chapter 7 Market Size and Forecast, By Application, 2021 - 2034 (USD Billion)
- 7.1 Key trends
- 7.2 Automotive
- 7.3 Marine
- 7.4 Aviation
- 7.5 Industrial
- 7.6 Others
Chapter 8 Market Size and Forecast, By Region, 2021 - 2034 (USD Billion)
- 8.1 Key trends
- 8.2 North America
- 8.2.1 U.S.
- 8.2.2 Canada
- 8.3 Europe
- 8.3.1 Germany
- 8.3.2 UK
- 8.3.3 France
- 8.3.4 Spain
- 8.3.5 Netherlands
- 8.4 Asia Pacific
- 8.4.1 China
- 8.4.2 India
- 8.4.3 Japan
- 8.4.4 South Korea
- 8.4.5 Australia
- 8.5 Middle East & Africa
- 8.5.1 Saudi Arabia
- 8.5.2 UAE
- 8.5.3 South Africa
- 8.6 Latin America
- 8.6.1 Brazil
- 8.6.2 Argentina
Chapter 9 Company Profiles
- 9.1 Arcadia eFuels
- 9.2 Archer Daniels Midland Co.
- 9.3 Ballard Power Systems, Inc.
- 9.4 Ceres Power Holding Plc
- 9.5 Climeworks AG
- 9.6 Clean Fuels Alliance America
- 9.7 Electrochaea GmbH
- 9.8 eFuel Pacific Limited
- 9.9 ExxonMobil
- 9.10 FuelCell Energy, Inc.
- 9.11 HIF Global
- 9.12 INFRA Synthetic Fuels, Inc.
- 9.13 Liquid Wind
- 9.14 LanzaJet
- 9.15 MAN Energy Solutions
- 9.16 Norsk E-Gasoline AS
- 9.17 Porsche
- 9.18 Sunfire GmbH
- 発行日
- 発行
- Global Market Insights Inc.
- ページ情報
- 英文 131 Pages
- 納期
- 2~3営業日


