
産業用e-fuel(合成燃料)の市場機会、成長促進要因、産業動向分析、2025~2034年予測
Industrial E-Fuel Market Opportunity, Growth Drivers, Industry Trend Analysis, and Forecast 2025 - 2034- 発行日
- ページ情報
- 英文 133 Pages
- 納期
- 2~3営業日
- 商品コード
- 1750594
- カスタマイズ可能 お客様のご希望に応じて、既存データの加工や未掲載情報(例:国別セグメント)の追加などの対応が可能です。詳細はお問い合わせください。
- 翻訳ツール提供対象 PDF対応AI翻訳ツールの無料貸し出しサービスのご利用が可能です
概要
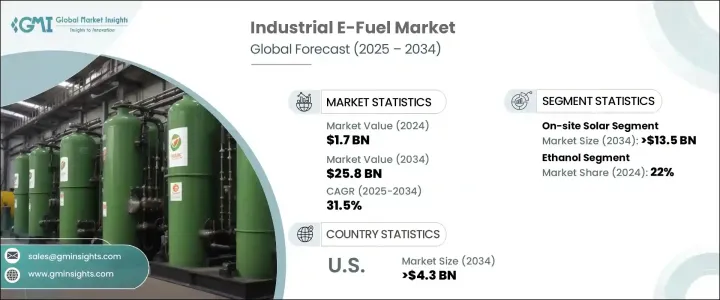
世界の産業用e-fuel(合成燃料)市場は、2024年には17億米ドルと評価され、世界の脱炭素化の推進と産業用途における持続可能な代替エネルギーへのニーズの高まりにより、CAGR 31.5%で成長し、2034年には258億米ドルに達すると推定されています。
産業界が従来の化石燃料に代わる実行可能な代替燃料を模索する中、e-fuelは製造、大型輸送、航空などの分野で説得力のあるソリューションとして浮上しています。効率とコスト管理の改善と相まって、高度な生産技術の統合は、こうした合成燃料の実現可能性を高め続けています。政府の支援策、クリーンエネルギー奨励策、世界の排出削減目標が採用を加速しています。
さらに、自然エネルギーと産業事業の統合が重視されるようになったことで、企業は長期的なカーボンニュートラルエネルギー枠組みを採用するようになりました。企業は、自社の戦略を世界的な持続可能性目標と整合させ、従来の化石エネルギー源への依存を減らす低排出燃料を優先させています。安定的で強靭なエネルギーサプライチェーンへの動きは、環境規制だけでなく、地域密着型のクリーンエネルギー生産がもたらす経済的メリットにも後押しされています。この動向は、特に再生可能電力だけでは十分でない、脱炭素化が困難なセクターにおいて、e-fuelの新たな可能性を引き出します。
| 市場範囲 | |
|---|---|
| 開始年 | 2024年 |
| 予測年 | 2025~2034年 |
| 開始金額 | 17億米ドル |
| 予測金額 | 258億米ドル |
| CAGR | 31.5% |
オンサイト太陽光発電分野は、Power-to-Xプロセスに必要な再生可能電力を供給するという重要な貢献を反映し、2034年までに135億米ドルを生み出すと予測されています。これらの再生可能エネルギー源は、カーボンニュートラルな燃料生産をサポートし、産業界が持続可能性の目標を達成するのに役立ちます。高度な制御システムと支持的な政策枠組みは、非電化再生可能エネルギー発電へのシフトを促進し、分散型e-fuel事業とシームレスに整合します。
エタノール分野は2024年に22%のシェアを占め、2034年までのCAGRは32%と予測されます。エタノールは現在の燃料インフラとの適合性が高く、さまざまな産業プロセスへの統合が容易なため、信頼性が高く拡張性の高い代替燃料となっています。生産技術の進歩に伴い、バイオベースのエタノールは、産業界が脱炭素化の義務に対応するための柔軟なソリューションを求める中で勢いを増しています。他の合成燃料とシームレスに混合できるエタノールは、持続可能なエネルギーへの移行を目指す産業環境において、その魅力を高めています。
米国の産業用e-fuel(2024年)の市場規模は2億3,540万米ドルで、2034年には43億米ドルに達すると推定されます。米国は、Power-to-Xやその他の新たな経路を通じてe-fuel生産を支援するため、多様な太陽光・風力資源を活用し続けています。燃料合成技術や炭素回収技術の進歩と相まって、こうした努力は、米国を産業用e-fuel移行における世界のフロントランナーとして確固たるものにしつつあります。
eFuel Pacific、Climeworks、Electrochaea、Archer Daniels Midland、Ballard Power Systems、MAN Energy Solutions、INFRA Synthetic Fuels、Porsche、HIF Global、Clean Fuels Alliance America、Sunfire、Arcadia eFuels、Liquid Wind、LanzaJet、FuelCell Energy、Norsk e-Fuel、ExxonMobil、Ceres Powerなどの主な企業は、技術革新、合弁事業、持続可能な技術開発を通じてその地位を強化しています。これらの企業は、生産能力の拡大、再生可能エネルギー施設への投資、戦略的提携による商業化の加速に注力しています。また、多くの企業が炭素回収技術を活用し、統合サプライチェーンを構築して、スケーラブルでクリーンな燃料の流通をサポートしています。
目次
第1章 調査手法と範囲
第2章 エグゼクティブサマリー
第3章 業界考察
- エコシステム分析
- トランプ政権の関税分析
- 貿易への影響
- 貿易量の混乱
- 報復措置
- 業界への影響
- 供給側の影響(原材料)
- 主要原材料の価格変動
- サプライチェーンの再構築
- 生産コストへの影響
- 需要側の影響(販売価格)
- 最終市場への価格伝達
- 市場シェアの動向
- 消費者の反応パターン
- 供給側の影響(原材料)
- 影響を受ける主要企業
- 戦略的な業界対応
- サプライチェーンの再構成
- 価格設定と製品戦略
- 政策関与
- 展望と今後の検討事項
- 貿易への影響
- 規制情勢
- 業界への影響要因
- 促進要因
- 業界の潜在的リスク・課題
- 成長可能性分析
- ポーター分析
- PESTEL分析
第4章 競合情勢
- イントロダクション
- 戦略的ダッシュボード
- 戦略的取り組み
- 企業の市場シェア分析
- 競合ベンチマーキング
- イノベーションとテクノロジーの情勢
第5章 市場規模・予測:再生可能エネルギー源別、2021~2034年
- 主要動向
- オンサイト太陽光発電
- 風力発電
第6章 市場規模・予測:技術別、2021~2034年
- 主要動向
- フィッシャー・トロプシュ
- eRWGS
- その他
第7章 市場規模・予測:製品別、2021~2034年
- 主要動向
- e-ガソリン
- e-ディーゼル
- e-灯油
- エタノール
- e-メタノール
- その他
第8章 市場規模・予測:地域別、2021~2034年
- 主要動向
- 北米
- 米国
- カナダ
- 欧州
- 英国
- ドイツ
- フランス
- オランダ
- スペイン
- アジア太平洋地域
- 中国
- インド
- 日本
- 韓国
- オーストラリア
- 中東・アフリカ
- サウジアラビア
- アラブ首長国連邦
- 南アフリカ
- ラテンアメリカ
- ブラジル
- アルゼンチン
第9章 企業プロファイル
- Archer Daniels Midland
- Arcadia eFuels
- Ballard Power Systems
- Ceres Power
- Clean Fuels Alliance America
- Climeworks
- Electrochaea
- eFuel Pacific
- ExxonMobil
- FuelCell Energy
- HIF Global
- INFRA Synthetic Fuels
- LanzaJet
- Liquid Wind
- MAN Energy Solutions
- Norsk e-Fuel
- Porsche
- Sunfire
目次
The Global Industrial E-Fuel Market was valued at USD 1.7 billion in 2024 and is estimated to grow at a CAGR of 31.5% to reach USD 25.8 billion by 2034, driven by the global push toward decarbonization and the rising need for sustainable energy alternatives across industrial applications. As industries search for viable replacements for conventional fossil fuels, e-fuels have emerged as a compelling solution for sectors such as manufacturing, heavy transport, and aviation. The integration of advanced production technologies, coupled with improvements in efficiency and cost control, continues to enhance the viability of these synthetic fuels. Supportive government initiatives, clean energy incentives, and global emission reduction targets accelerate adoption.
Moreover, the heightened emphasis on integrating renewables with industrial operations encourages businesses to adopt long-term, carbon-neutral energy frameworks. Companies align their strategies with global sustainability targets, prioritizing low-emission fuels that reduce dependence on traditional fossil energy sources. The move toward stable and resilient energy supply chains is not only driven by environmental regulations but also by the economic advantages of localized, clean energy production. This trend unlocks new potential for e-fuels, especially in hard-to-decarbonize sectors where renewable electricity alone may not suffice.
| Market Scope | |
|---|---|
| Start Year | 2024 |
| Forecast Year | 2025-2034 |
| Start Value | $1.7 billion |
| Forecast Value | $25.8 billion |
| CAGR | 31.5% |
The on-site solar segment is projected to generate USD 13.5 billion by 2034, reflecting its critical contribution in providing the renewable electricity required for Power-to-X processes. These renewable energy sources support carbon-neutral fuel production and help industries meet sustainability goals. Advanced control systems and supportive policy frameworks fuel the shift toward off-grid renewable generation, which aligns seamlessly with decentralized e-fuel operations.
The ethanol segment held a 22% share in 2024 and is projected to grow at a CAGR of 32% through 2034. Its compatibility with current fuel infrastructure and ease of integration into various industrial processes have made ethanol a reliable and scalable alternative. With ongoing advances in production technologies, bio-based ethanol is gaining momentum as industries seek flexible solutions to meet decarbonization mandates. Its ability to blend seamlessly with other synthetic fuels enhances its appeal in industrial settings, transitioning toward sustainable energy.
United States Industrial E-Fuel Market generated USD 235.4 million in 2024 and is estimated to reach USD 4.3 billion by 2034, underpinned by supportive federal policies, clean energy funding programs, and increasing deployment of renewable technologies. The U.S. continues to leverage a diverse mix of solar and wind resources to support e-fuel production through Power-to-X and other emerging pathways. Coupled with advancements in fuel synthesis and carbon capture technologies, these efforts are helping to cement the U.S. as a global frontrunner in the industrial e-fuel transition.
Key players such as eFuel Pacific, Climeworks, Electrochaea, Archer Daniels Midland, Ballard Power Systems, MAN Energy Solutions, INFRA Synthetic Fuels, Porsche, HIF Global, Clean Fuels Alliance America, Sunfire, Arcadia eFuels, Liquid Wind, LanzaJet, FuelCell Energy, Norsk e-Fuel, ExxonMobil, and Ceres Power are strengthening their position through innovation, joint ventures, and sustainable technology development. These companies are focused on expanding production capacity, investing in renewable-powered facilities, and forming strategic alliances to accelerate commercialization. Many are also leveraging carbon capture technologies and creating integrated supply chains to support scalable, clean fuel distribution.
Table of Contents
Chapter 1 Methodology & Scope
- 1.1 Market definitions
- 1.2 Base estimates & calculations
- 1.3 Forecast calculation
- 1.4 Data sources
- 1.4.1 Primary
- 1.4.2 Secondary
- 1.4.2.1 Paid
- 1.4.2.2 Public
Chapter 2 Executive Summary
- 2.1 Industry synopsis, 2021 - 2034
Chapter 3 Industry Insights
- 3.1 Industry ecosystem analysis
- 3.2 Trump administration tariff analysis
- 3.2.1 Impact on trade
- 3.2.1.1 Trade volume disruptions
- 3.2.1.2 Retaliatory measures
- 3.2.2 Impact on the industry
- 3.2.2.1 Supply-side impact (raw materials)
- 3.2.2.1.1 Price volatility in key materials
- 3.2.2.1.2 Supply chain restructuring
- 3.2.2.1.3 Production cost implications
- 3.2.2.2 Demand-side impact (selling price)
- 3.2.2.2.1 Price transmission to end markets
- 3.2.2.2.2 Market share dynamics
- 3.2.2.2.3 Consumer response patterns
- 3.2.2.1 Supply-side impact (raw materials)
- 3.2.3 Key companies impacted
- 3.2.4 Strategic industry responses
- 3.2.4.1 Supply chain reconfiguration
- 3.2.4.2 Pricing and product strategies
- 3.2.4.3 Policy engagement
- 3.2.5 Outlook and future considerations
- 3.2.1 Impact on trade
- 3.3 Regulatory landscape
- 3.4 Industry impact forces
- 3.4.1 Growth drivers
- 3.4.2 Industry pitfalls & challenges
- 3.5 Growth potential analysis
- 3.6 Porter's Analysis
- 3.6.1 Bargaining power of suppliers
- 3.6.2 Bargaining power of buyers
- 3.6.3 Threat of new entrants
- 3.6.4 Threat of substitutes
- 3.7 PESTEL Analysis
Chapter 4 Competitive landscape, 2025
- 4.1 Introduction
- 4.2 Strategic dashboard
- 4.3 Strategic initiatives
- 4.4 Company market share analysis
- 4.5 Competitive benchmarking
- 4.6 Innovation & technology landscape
Chapter 5 Market Size and Forecast, By Renewable Source, 2021 - 2034 (USD Million)
- 5.1 Key trends
- 5.2 On-site solar
- 5.3 Wind
Chapter 6 Market Size and Forecast, By Technology, 2021 - 2034 (USD Million)
- 6.1 Key trends
- 6.2 Fischer-tropsch
- 6.3 eRWGS
- 6.4 Others
Chapter 7 Market Size and Forecast, By Product, 2021 - 2034 (USD Million)
- 7.1 Key trends
- 7.2 E-gasoline
- 7.3 E-diesel
- 7.4 E-kerosene
- 7.5 Ethanol
- 7.6 E-methanol
- 7.7 Others
Chapter 8 Market Size and Forecast, By Region, 2021 - 2034 (USD Million)
- 8.1 Key trends
- 8.2 North America
- 8.2.1 U.S.
- 8.2.2 Canada
- 8.3 Europe
- 8.3.1 UK
- 8.3.2 Germany
- 8.3.3 France
- 8.3.4 Netherlands
- 8.3.5 Spain
- 8.4 Asia Pacific
- 8.4.1 China
- 8.4.2 India
- 8.4.3 Japan
- 8.4.4 South Korea
- 8.4.5 Australia
- 8.5 Middle East & Africa
- 8.5.1 Saudi Arabia
- 8.5.2 UAE
- 8.5.3 South Africa
- 8.6 Latin America
- 8.6.1 Brazil
- 8.6.2 Argentina
Chapter 9 Company Profiles
- 9.1 Archer Daniels Midland
- 9.2 Arcadia eFuels
- 9.3 Ballard Power Systems
- 9.4 Ceres Power
- 9.5 Clean Fuels Alliance America
- 9.6 Climeworks
- 9.7 Electrochaea
- 9.8 eFuel Pacific
- 9.9 ExxonMobil
- 9.10 FuelCell Energy
- 9.11 HIF Global
- 9.12 INFRA Synthetic Fuels
- 9.13 LanzaJet
- 9.14 Liquid Wind
- 9.15 MAN Energy Solutions
- 9.16 Norsk e-Fuel
- 9.17 Porsche
- 9.18 Sunfire
- 発行日
- 発行
- Global Market Insights Inc.
- ページ情報
- 英文 133 Pages
- 納期
- 2~3営業日


