
|
市場調査レポート
商品コード
1750505
パラレルスイッチギアの市場機会、成長促進要因、産業動向分析、2025年~2034年予測Paralleling Switchgear Market Opportunity, Growth Drivers, Industry Trend Analysis, and Forecast 2025 - 2034 |
||||||
カスタマイズ可能
|
|||||||
| パラレルスイッチギアの市場機会、成長促進要因、産業動向分析、2025年~2034年予測 |
|
出版日: 2025年05月13日
発行: Global Market Insights Inc.
ページ情報: 英文 123 Pages
納期: 2~3営業日
|

全表示
- 概要
- 目次
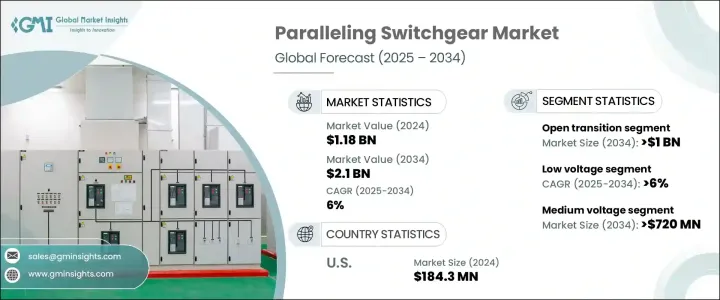
パラレルスイッチギアの世界市場規模は、2024年に11億8,000万米ドルとなり、CAGR 6%で成長し、2034年には21億米ドルに達すると予測されています。
この増加傾向は、様々な産業で継続的かつ効率的な配電に対する需要が増加していることが大きな要因となっています。近代的なインフラが拡大し続ける中、信頼性の高い電力供給を維持することの重要性が高まっています。さまざまな分野の施設で、安定した電力を確保し、停電に伴うリスクを軽減するシステムが採用されています。パラレルスイッチギアの採用が急増しているのは、複数の電源を同期させ、電気負荷全体の安定性を維持するのに役立つからです。
これらのシステムは、複数の発電ユニットをユーティリティ・グリッドと統合するように設計されており、エネルギー分配を最適化し、ダウンタイムを最小限に抑えながら、電源間のシームレスな移行を可能にします。この技術は、わずかな中断でも大きなパフォーマンスの中断や経済的損失につながりかねない、非常にセンシティブな運用環境において不可欠なコンポーネントとなりつつあります。負荷分散、冗長性、運用効率をサポートするインテリジェントな電源管理ソリューションへの信頼が高まっていることが、市場を前進させています。都市部や工業地帯で電力需要が増加する中、パラレルスイッチギアを使用することで、グリッド変動や停電に耐えられる回復力のある施設を維持することができます。
| 市場範囲 | |
|---|---|
| 開始年 | 2024 |
| 予測年 | 2025-2034 |
| 開始金額 | 11億8,000万米ドル |
| 予測金額 | 21億米ドル |
| CAGR | 6% |
もう一つの主要な成長要因は、バックアップ電源システムの利用の拡大です。事業規模が拡大し複雑化するにつれて、重要なプロセスにおいて中断のない電力を維持することがより重視されるようになっています。バックアップシステムは現在、大規模なビル、研究所、施設に広く組み込まれており、多くの場合、複数の発電機ユニットが関与しています。パラレルスイッチギアは、自動または手動の同期と負荷共有を可能にすることで、この統合を促進する重要な役割を果たします。業務を止めることなく一次情報と二次情報を簡単に切り替えられることは、事業継続計画における戦略的な利点となっています。
広範な市場の中で、低電圧分野は2034年までのCAGRが6%を超えると予想されています。この分野は、産業界が安全性と性能の両方を提供するソリューションをますます求めるようになり、牽引力を増しています。エネルギー使用の合理化、自動化、よりスマートな工場環境の重視が、低電圧パラレルスイッチギアの需要を押し上げています。産業がよりデジタル化され、効率的なオペレーションへと移行する中、これらのシステムは、高負荷のアプリケーションにおいても、より安全かつ確実に電力を管理・配電するのに役立っています。エネルギーの浪費を最小限に抑えながら、一貫したオペレーションをサポートするその役割は、さまざまな製造業や加工業で好んで選ばれています。
地域別では、米国が近年着実な市場成長を示しています。同国のパラレルスイッチギア市場は、2022年に1億6,830万米ドルであったが、2023年には1億7,590万米ドルに上昇し、さらに2024年には1億8,430万米ドルに達しました。この一貫した上昇は、部門を問わずミッションクリティカルな活動をサポートできる堅牢な電力インフラに対する需要の増加を反映しています。技術的に先進的でインフラが多い環境での無停電電源供給へのニーズが、引き続き製品採用を後押ししています。施設が拡大し、より弾力的で適応性の高いエネルギー管理システムが採用されるにつれて、市場の見通しは引き続き明るいです。
業界の主要プレーヤーは、技術的に高度なソリューションを提供し、重要なインフラ・プロジェクトでの存在感を深めることで、その地位を強化しています。電力システムとオートメーションに関する専門知識を確立している企業は、信頼性が高くインテリジェントなエネルギー・ソリューションに対する需要の高まりに乗じています。研究開発に戦略的に注力することで、進化する市場ニーズを先取りし、現代の要件に合わせた多様な高性能システムを供給しています。ユーティリティのアップグレードとスマート・インフラ・プロジェクトが勢いを増す中、幅広いポートフォリオとイノベーション主導のアプローチを持つ主要企業は、市場の次の成長段階をリードする立場にあります。
目次
第1章 調査手法と範囲
第2章 エグゼクティブサマリー
第3章 業界考察
- エコシステム分析
- トランプ政権の関税分析
- 貿易への影響
- 貿易量の混乱
- 報復措置
- 業界への影響
- 供給側の影響(原材料)
- 主要原材料の価格変動
- サプライチェーンの再構築
- 生産コストへの影響
- 需要側の影響(販売価格)
- 最終市場への価格伝達
- 市場シェアの動向
- 消費者の反応パターン
- 供給側の影響(原材料)
- 影響を受ける主要企業
- 戦略的な業界対応
- サプライチェーンの再構成
- 価格設定と製品戦略
- 政策関与
- 展望と今後の検討事項
- 貿易への影響
- 規制情勢
- 業界への影響要因
- 促進要因
- 業界の潜在的リスク&課題
- 成長可能性分析
- ポーター分析
- PESTEL分析
第4章 競合情勢
- 戦略的ダッシュボード
- イノベーションと持続可能性の情勢
第5章 市場規模・予測:タイプ別、2021-2034
- 主要動向
- オープントランジション
- クローズドトランジション
第6章 市場規模・予測:電圧別、2021-2034
- 主要動向
- 低電圧
- 中電圧
第7章 市場規模・予測:用途別、2021-2034
- 主要動向
- 常用
- 非常用
- ピークシェービング
第8章 市場規模・予測:最終用途別、2021-2034
- 主要動向
- 産業用
- 商業用
- ITおよび通信
- ヘルスケア
- その他
第9章 市場規模・予測:地域別、2021-2034
- 主要動向
- 北米
- 米国
- カナダ
- メキシコ
- 欧州
- 英国
- フランス
- ドイツ
- イタリア
- ロシア
- スペイン
- アジア太平洋地域
- 中国
- オーストラリア
- インド
- 日本
- 韓国
- 中東・アフリカ
- サウジアラビア
- アラブ首長国連邦
- トルコ
- 南アフリカ
- エジプト
- ラテンアメリカ
- ブラジル
- アルゼンチン
第10章 企業プロファイル
- ABB
- Caterpillar
- Cummins
- Eaton
- Enercon Engineering
- General Electric
- Industrial Electric MFG.
- KDM Steel
- Kohler
- Nixon Power Services
- Rolls-Royce(MTU Onsite Energy)
- Schneider Electric
- Siemens
- Thomson Power Systems
The Global Paralleling Switchgear Market was valued at USD 1.18 billion in 2024 and is estimated to grow at a CAGR of 6% to reach USD 2.1 billion by 2034. This upward trend is largely fueled by the increasing demand for continuous and efficient power distribution across various industries. As modern infrastructures continue to expand, the importance of maintaining a reliable power supply has become critical. Facilities across multiple sectors are adopting systems that ensure consistent electricity flow and mitigate risks associated with power failures. The adoption of paralleling switchgear has surged as it helps synchronize multiple power sources and maintain stability across electrical loads, particularly in environments where power continuity is essential.
These systems are designed to integrate several power generation units with the utility grid, allowing seamless transitions between sources while optimizing energy distribution and minimizing downtime. This technology is becoming an indispensable component in highly sensitive operational settings, where even the slightest interruption can result in major performance disruptions or financial losses. The increasing reliance on intelligent power management solutions that support load balancing, redundancy, and operational efficiency is propelling the market forward. As power demands rise in urban and industrial regions, the use of paralleling switchgear ensures facilities remain resilient and capable of withstanding grid fluctuations or outages.
| Market Scope | |
|---|---|
| Start Year | 2024 |
| Forecast Year | 2025-2034 |
| Start Value | $1.18 Billion |
| Forecast Value | $2.1 Billion |
| CAGR | 6% |
Another key growth driver is the growing use of backup power systems. As operations scale up in size and complexity, there is a stronger emphasis on maintaining uninterrupted electricity for critical processes. Backup systems are now widely integrated into large buildings, labs, and institutional facilities, often involving multiple generator units. Paralleling switchgear plays a vital role in facilitating this integration by enabling automatic or manual synchronization and load-sharing, which ensures a seamless power transfer during main supply disruptions. The ability to switch effortlessly between primary and secondary sources without halting operations has become a strategic advantage in business continuity planning.
Within the broader market, the low voltage segment is anticipated to witness a CAGR exceeding 6% through 2034. This segment is gaining traction as industries increasingly seek solutions that offer both safety and performance. The emphasis on streamlined energy usage, automation, and smarter factory environments is boosting demand for low voltage paralleling switchgear. As industries transition toward more digitized and efficient operations, these systems are helping manage and distribute electricity more safely and reliably, even in high-load applications. Their role in supporting operational consistency while minimizing energy waste has made them a preferred choice across various manufacturing and processing industries.
Regionally, the United States has demonstrated steady market growth over recent years. The country's paralleling switchgear market stood at USD 168.3 million in 2022, rose to USD 175.9 million in 2023, and further reached USD 184.3 million in 2024. This consistent rise reflects the increasing demand for robust power infrastructure that can support mission-critical activities across sectors. The need for uninterrupted power supply in technologically advanced and infrastructure-heavy environments continues to drive product adoption. The market outlook remains positive as facilities expand and adopt more resilient and adaptable energy management systems.
Key industry players are reinforcing their positions by offering technologically advanced solutions and deepening their presence in critical infrastructure projects. Companies with established expertise in power systems and automation are capitalizing on the rising demand for dependable and intelligent energy solutions. Their strategic focus on research and development has enabled them to stay ahead of evolving market needs, supplying a diverse range of high-performance systems tailored to modern requirements. As utility upgrades and smart infrastructure projects gain momentum, companies with a broad portfolio and innovation-driven approach are well-positioned to lead the next phase of market growth.
Table of Contents
Chapter 1 Methodology & Scope
- 1.1 Market definitions
- 1.2 Base estimates & calculations
- 1.3 Forecast calculation
- 1.4 Data sources
- 1.4.1 Primary
- 1.4.2 Secondary
- 1.4.2.1 Paid
- 1.4.2.2 Public
Chapter 2 Executive Summary
- 2.1 Industry synopsis, 2021 – 2034
Chapter 3 Industry Insights
- 3.1 Industry ecosystem analysis
- 3.2 Trump administration tariff analysis
- 3.2.1 Impact on trade
- 3.2.1.1 Trade volume disruptions
- 3.2.1.2 Retaliatory measures
- 3.2.2 Impact on the industry
- 3.2.2.1 Supply-side impact (raw materials)
- 3.2.2.1.1 Price volatility in key materials
- 3.2.2.1.2 Supply chain restructuring
- 3.2.2.1.3 Production cost implications
- 3.2.2.2 Demand-side impact (selling price)
- 3.2.2.2.1 Price transmission to end markets
- 3.2.2.2.2 Market share dynamics
- 3.2.2.2.3 Consumer response patterns
- 3.2.2.1 Supply-side impact (raw materials)
- 3.2.3 Key companies impacted
- 3.2.4 Strategic industry responses
- 3.2.4.1 Supply chain reconfiguration
- 3.2.4.2 Pricing and product strategies
- 3.2.4.3 Policy engagement
- 3.2.5 Outlook and future considerations
- 3.2.1 Impact on trade
- 3.3 Regulatory landscape
- 3.4 Industry impact forces
- 3.4.1 Growth drivers
- 3.4.2 Industry pitfalls & challenges
- 3.5 Growth potential analysis
- 3.6 Porter's analysis
- 3.6.1 Bargaining power of suppliers
- 3.6.2 Bargaining power of buyers
- 3.6.3 Threat of new entrants
- 3.6.4 Threat of substitutes
- 3.7 PESTEL analysis
Chapter 4 Competitive Landscape, 2024
- 4.1 Strategic dashboard
- 4.2 Innovation & sustainability landscape
Chapter 5 Market Size and Forecast, By Type, 2021 - 2034 (USD Million)
- 5.1 Key trends
- 5.2 Open transition
- 5.3 Closed transition
Chapter 6 Market Size and Forecast, By Voltage, 2021 - 2034 (USD Million)
- 6.1 Key trends
- 6.2 Low
- 6.3 Medium
Chapter 7 Market Size and Forecast, By Application, 2021 - 2034 (USD Million)
- 7.1 Key trends
- 7.2 Prime
- 7.3 Standby
- 7.4 Peak shave
Chapter 8 Market Size and Forecast, By End Use, 2021 - 2034 (USD Million)
- 8.1 Key trends
- 8.2 Industrial
- 8.3 Commercial
- 8.3.1 IT & Telecom
- 8.3.2 Healthcare
- 8.3.3 Others
Chapter 9 Market Size and Forecast, By Region, 2021 - 2034 (USD Million)
- 9.1 Key trends
- 9.2 North America
- 9.2.1 U.S.
- 9.2.2 Canada
- 9.2.3 Mexico
- 9.3 Europe
- 9.3.1 UK
- 9.3.2 France
- 9.3.3 Germany
- 9.3.4 Italy
- 9.3.5 Russia
- 9.3.6 Spain
- 9.4 Asia Pacific
- 9.4.1 China
- 9.4.2 Australia
- 9.4.3 India
- 9.4.4 Japan
- 9.4.5 South Korea
- 9.5 Middle East & Africa
- 9.5.1 Saudi Arabia
- 9.5.2 UAE
- 9.5.3 Turkey
- 9.5.4 South Africa
- 9.5.5 Egypt
- 9.6 Latin America
- 9.6.1 Brazil
- 9.6.2 Argentina
Chapter 10 Company Profiles
- 10.1 ABB
- 10.2 Caterpillar
- 10.3 Cummins
- 10.4 Eaton
- 10.5 Enercon Engineering
- 10.6 General Electric
- 10.7 Industrial Electric MFG.
- 10.8 KDM Steel
- 10.9 Kohler
- 10.10 Nixon Power Services
- 10.11 Rolls-Royce (MTU Onsite Energy)
- 10.12 Schneider Electric
- 10.13 Siemens
- 10.14 Thomson Power Systems
