
|
市場調査レポート
商品コード
1750459
建設用プライム発電機の市場機会、成長促進要因、産業動向分析、2025年~2034年予測Construction Prime Power Generators Market Opportunity, Growth Drivers, Industry Trend Analysis, and Forecast 2025 - 2034 |
||||||
カスタマイズ可能
|
|||||||
| 建設用プライム発電機の市場機会、成長促進要因、産業動向分析、2025年~2034年予測 |
|
出版日: 2025年05月16日
発行: Global Market Insights Inc.
ページ情報: 英文 120 Pages
納期: 2~3営業日
|

全表示
- 概要
- 目次
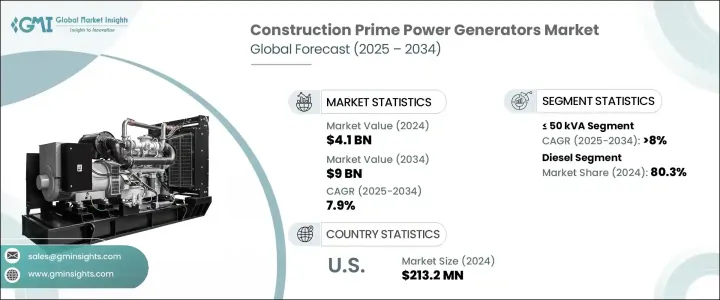
世界の建設用プライム発電機市場は2024年に41億米ドルと評価され、CAGR7.9%で成長し、2034年までには90億米ドルに達すると推定されています。
建設活動全体における一貫した中断のない電力供給に対する需要の高まりは、業界のダイナミクスを形成する上で重要な役割を果たすと考えられています。新興経済諸国における工業化とインフラ開発に後押しされ、建設セクターが進化を続けるなか、信頼できるエネルギー源の必要性はますます高まっています。プライム発電機は、特にグリッド接続が制限されていたり、利用できなかったりするプロジェクトにおいて、信頼できるエネルギーバックアップソリューションとして支持を集めています。エネルギーの信頼性と効率性が重視されるようになり、持続可能な代替エネルギーを統合する取り組みが進んでいることも相まって、成長の可能性がさらに高まっています。
様々な地域で製造施設や産業ユニットの開発が活発化する中、費用対効果が高く堅牢な発電ソリューションへの要求が強まっています。特に都市化地域における建設活動は大幅に増加しており、発電機セットの幅広い採用を促しています。さらに、重要な機械やプロセスの稼働を支える安定した電力供給の必要性が、高度な発電機技術への投資を促進しています。エネルギー安全保障に対する懸念の高まりと相まって、世界のいくつかの地域で電力途絶の頻度が増加していることから、信頼性の高いバックアップシステムを導入することの重要性がますます高まっています。
| 市場範囲 | |
|---|---|
| 開始年 | 2024年 |
| 予測年 | 2025年~2034年 |
| 開始金額 | 41億米ドル |
| 予測金額 | 90億米ドル |
| CAGR | 7.9% |
電化への取り組みやインフラ整備への投資が、特に非電化地域やサービスが行き届いていない地域で拡大していることも、この市場の上昇に寄与しています。特に農村部や半都市部では、エネルギーへのアクセスを強化しようとする地域が増えており、需要と供給のギャップを埋めるために発電機セットが導入されています。老朽化した発電機の交換を含め、旧式の電力システムを近代化する方向にシフトしていることが、市場成長にさらなる弾みをつけています。同様に、仮設や移動式の建設セットアップにおける拡張性のある発電ソリューションへの需要が、使いやすさと展開の柔軟性を提供するポータブル発電機モデルの採用に拍車をかけています。
定格電力に関しては、市場は50 kVA未満、50 kVA~125 kVA、125 kVA~200 kVA、200 kVA~330 kVA、330 kVA~750 kVA、750 kVA以上セグメントに分類されます。50 kVA未満のセグメントはより速いペースで成長し、2034年までのCAGRは8%を超えると予測されます。この成長を後押ししているのは、中小規模の建設プロジェクトに最適な、小型・軽量の発電システムに対するニーズの高まりです。可搬性と低消費電力により、予算や空間的制約のあるプロジェクトにとって魅力的な選択肢となっています。
市場はさらに、燃料タイプによってディーゼルとガスに区分されます。ディーゼルエンジン搭載の建設用プライム発電機が2024年の市場全体の80.3%を占め、市場を独占しています。この優位性を支えているのは、遠隔地や非電化地域でディーゼル燃料が広く利用できることであり、継続的なエネルギー支援を必要とする建設現場にとって実用的な選択肢となっています。ディーゼル発電機の初期投資コストが比較的低いことも、特に予算に敏感な建設現場において、その魅力を高めています。
従来のディーゼル発電機やガス発電機と、太陽光発電や蓄電池などの再生可能エネルギー源を組み合わせたハイブリッドシステムも勢いを増しています。この変化の背景には、環境意識の高まりと燃料費の高騰があり、利害関係者はよりエネルギー効率の高い、環境に優しい代替手段の採用を促しています。こうしたハイブリッドシステムは、電力供給の高い信頼性を維持しながら化石燃料への依存を減らすための実行可能な解決策と見なされるようになってきています。
米国では、建設用プライム発電機市場は過去数年にわたって着実な成長を見せており、2022年には1億8,720万米ドル、2023年には2億50万米ドル、2024年には2億1,320万米ドルの評価を得ています。この良好な動向は、環境基準に適合したエネルギー効率の高い発電機に対する需要の高まりとともに、低排出技術を促進する規制枠組みに支えられています。同国は、建設慣行の近代化を進め、よりスマートな電力システムを統合しているため、力強い成長軌道を維持すると予想されます。
建設用プライム発電機を形成する主要企業には、Atlas Copco、Ashok Leyland、Briggs &Stratton、Cummins、Caterpillar、Deere &Company、HIMOINSA、Generac Power Systems、Kirloskar、Mitsubishi Heavy Industries、Mahindra POWEROL、PR INDUSTRIAL、Rehlko、Rolls-Royce、Scania、Rapid Power Generation、Siemens Energy、Wartsila、Volvo Penta、YANMAR HOLDINGSなどがあります。これらの企業は、進化する顧客ニーズに応えるため、技術的進歩に積極的に投資し、ポートフォリオを拡大しています。
目次
第1章 調査手法と範囲
第2章 エグゼクティブサマリー
第3章 業界考察
- 業界エコシステム分析
- トランプ政権の関税分析
- 貿易への影響
- 貿易量の混乱
- 報復措置
- 業界への影響
- 供給側の影響(原材料)
- 主要原材料の価格変動
- サプライチェーンの再構築
- 生産コストへの影響
- 需要側の影響(販売価格)
- 最終市場への価格伝達
- 市場シェアの動向
- 消費者の反応パターン
- 供給側の影響(原材料)
- 影響を受ける主要企業
- 戦略的な業界対応
- サプライチェーンの再構成
- 価格設定と製品戦略
- 政策関与
- 展望と今後の検討事項
- 貿易への影響
- 規制情勢
- 業界への影響要因
- 成長促進要因
- 業界の潜在的リスク・課題
- 成長可能性分析
- ポーター分析
- PESTEL分析
第4章 競合情勢
- イントロダクション
- 企業の市場シェア分析
- 戦略的ダッシュボード
- 戦略的取り組み
- 競合ベンチマーキング
- イノベーションと持続可能性の情勢
第5章 市場規模・予測:出力別、2021年~2034年
- 主要動向
- 50kVA未満
- 50kVA~125kVA以上
- 125kVA~200kVA以上
- 200kVA~330kVA以上
- 330kVA~750kVA以上
- 750kVA以上
第6章 市場規模・予測:燃料別、2021年~2034年
- 主要動向
- ディーゼル
- ガス
第7章 市場規模・予測:地域別、2021年~2034年
- 主要動向
- 北米
- 米国
- カナダ
- 欧州
- ロシア
- 英国
- ドイツ
- フランス
- スペイン
- オーストリア
- イタリア
- アジア太平洋
- 中国
- オーストラリア
- インド
- 日本
- 韓国
- インドネシア
- マレーシア
- タイ
- ベトナム
- フィリピン
- ミャンマー
- バングラデシュ
- 中東
- サウジアラビア
- アラブ首長国連邦
- カタール
- トルコ
- イラン
- オマーン
- アフリカ
- エジプト
- ナイジェリア
- アルジェリア
- 南アフリカ
- アンゴラ
- ケニア
- モザンビーク
- ラテンアメリカ
- ブラジル
- メキシコ
- アルゼンチン
- チリ
第8章 企業プロファイル
- Ashok Leyland
- Atlas Copco
- Briggs &Stratton
- Caterpillar
- Cummins
- Deere &Company
- Generac Power Systems
- HIMOINSA
- Kirloskar
- Mahindra POWEROL
- Mitsubishi Heavy Industries
- PR INDUSTRIAL
- Rapid Power Generation
- Rehlko
- Rolls-Royce
- Scania
- Siemens Energy
- Volvo Penta
- Wartsila
- YANMAR HOLDINGS
The Global Construction Prime Power Generators Market was valued at USD 4.1 billion in 2024 and is estimated to grow at a CAGR of 7.9% to reach USD 9 billion by 2034. The rising demand for consistent and uninterrupted power supply across construction activities is set to play a vital role in shaping industry dynamics. As the construction sector continues to evolve, fueled by industrialization and infrastructure development in emerging economies, the need for dependable energy sources is becoming increasingly critical. Prime power generators are gaining traction as a reliable energy backup solution, particularly in projects where grid connectivity is limited or unavailable. The growing emphasis on energy reliability and efficiency, coupled with ongoing efforts to integrate sustainable energy alternatives, is further amplifying growth potential.
With an upswing in the development of manufacturing facilities and industrial units across various regions, the requirement for cost-effective and robust power generation solutions has intensified. Construction activities, particularly in urbanizing areas, are seeing a substantial increase, encouraging wider adoption of generator sets. Additionally, the need for a consistent electricity supply to support the operation of essential machinery and processes is driving investments in advanced generator technologies. The increasing frequency of power disruptions in several parts of the world, combined with rising concerns over energy security, has only reinforced the importance of having reliable backup systems in place.
| Market Scope | |
|---|---|
| Start Year | 2024 |
| Forecast Year | 2025-2034 |
| Start Value | $4.1 Billion |
| Forecast Value | $9 Billion |
| CAGR | 7.9% |
Growing investments in electrification efforts and infrastructure development, especially in off-grid and underserved areas, are also contributing to the upward momentum of this market. As more regions strive to enhance energy accessibility, particularly in rural and semi-urban locations, generator sets are being deployed to bridge the gap between demand and supply. The shift toward modernizing outdated power systems, including the replacement of aging generators, is adding further impetus to market growth. Likewise, the demand for scalable power generation solutions in temporary and mobile construction setups is fueling the adoption of portable generator models that offer ease of use and deployment flexibility.
In terms of power rating, the market is categorized into <= 50 kVA > 50 kVA - 125 kVA, > 125 kVA - 200 kVA, > 200 kVA - 330 kVA, > 330 kVA - 750 kVA, and > 750 kVA segments. The <= 50 kVA segment is forecasted to grow at a faster pace, with a CAGR exceeding 8% through 2034. This growth is being propelled by the increasing need for compact and lightweight power generation systems, which are ideal for small to medium-scale construction projects. Their portability and lower power consumption make them an attractive option for projects with constrained budgets or spatial limitations.
The market is further segmented by fuel type into diesel and gas. Diesel-powered construction prime power generators dominated the market in 2024, accounting for 80.3% of the total share. This dominance is supported by the widespread availability of diesel fuel in remote and off-grid areas, making it a practical choice for construction sites that require continuous energy support. The relatively lower upfront investment cost of diesel generators also adds to their appeal, particularly in budget-sensitive construction environments.
Hybrid systems that combine traditional diesel or gas-powered generators with renewable energy sources such as solar or battery storage are gaining momentum as well. This shift is driven by growing environmental awareness and rising fuel costs, encouraging stakeholders to adopt more energy-efficient and eco-friendly alternatives. These hybrid systems are increasingly seen as a viable solution to reduce dependency on fossil fuels while maintaining high reliability in power delivery.
In the United States, the construction prime power generators market has shown steady growth over the past few years, with valuations of USD 187.2 million in 2022, USD 200.5 million in 2023, and USD 213.2 million in 2024. This positive trend is being supported by regulatory frameworks promoting lower-emission technologies alongside rising demand for energy-efficient gensets that align with environmental standards. The country is expected to maintain a strong growth trajectory as it continues to modernize its construction practices and integrate smarter power systems.
Leading players shaping the construction prime power generators landscape include Atlas Copco, Ashok Leyland, Briggs & Stratton, Cummins, Caterpillar, Deere & Company, HIMOINSA, Generac Power Systems, Kirloskar, Mitsubishi Heavy Industries, Mahindra POWEROL, PR INDUSTRIAL, Rehlko, Rolls-Royce, Scania, Rapid Power Generation, Siemens Energy, Wartsila, Volvo Penta, and YANMAR HOLDINGS. These companies are actively investing in technological advancements and expanding their portfolios to cater to evolving customer needs.
Table of Contents
Chapter 1 Methodology & Scope
- 1.1 Research design
- 1.2 Market estimates & forecast parameters
- 1.3 Forecast calculation
- 1.4 Data sources
- 1.4.1 Primary
- 1.4.2 Secondary
- 1.4.2.1 Paid
- 1.4.2.2 Public
- 1.5 Market definitions
Chapter 2 Executive Summary
- 2.1 Industry synopsis, 2021 - 2034
Chapter 3 Industry Insights
- 3.1 Industry ecosystem analysis
- 3.2 Trump administration tariffs analysis
- 3.2.1 Impact on trade
- 3.2.1.1 Trade volume disruptions
- 3.2.1.2 Retaliatory measures
- 3.2.2 Impact on the industry
- 3.2.2.1 Supply-side impact (raw materials)
- 3.2.2.1.1 Price volatility in key materials
- 3.2.2.1.2 Supply chain restructuring
- 3.2.2.1.3 Production cost implications
- 3.2.2.2 Demand-side impact (selling price)
- 3.2.2.2.1 Price transmission to end markets
- 3.2.2.2.2 Market share dynamics
- 3.2.2.2.3 Consumer response patterns
- 3.2.2.1 Supply-side impact (raw materials)
- 3.2.3 Key companies impacted
- 3.2.4 Strategic industry responses
- 3.2.4.1 Supply chain reconfiguration
- 3.2.4.2 Pricing and product strategies
- 3.2.4.3 Policy engagement
- 3.2.5 Outlook and future considerations
- 3.2.1 Impact on trade
- 3.3 Regulatory landscape
- 3.4 Industry impact forces
- 3.4.1 Growth drivers
- 3.4.2 Industry pitfalls & challenges
- 3.5 Growth potential analysis
- 3.6 Porter's analysis
- 3.6.1 Bargaining power of suppliers
- 3.6.2 Bargaining power of buyers
- 3.6.3 Threat of new entrants
- 3.6.4 Threat of substitutes
- 3.7 PESTEL analysis
Chapter 4 Competitive Landscape, 2025
- 4.1 Introduction
- 4.2 Company market share analysis, 2024
- 4.3 Strategic dashboard
- 4.4 Strategic initiatives
- 4.5 Competitive benchmarking
- 4.6 Innovation & sustainability landscape
Chapter 5 Market Size and Forecast, By Power Rating, 2021 - 2034 (USD Million & Units)
- 5.1 Key trends
- 5.2 ≤ 50 kVA
- 5.3 > 50 kVA - 125 kVA
- 5.4 > 125 kVA - 200 kVA
- 5.5 > 200 kVA - 330 kVA
- 5.6 > 330 kVA - 750 kVA
- 5.7 > 750 kVA
Chapter 6 Market Size and Forecast, By Fuel, 2021 - 2034 (USD Million & Units)
- 6.1 Key trends
- 6.2 Diesel
- 6.3 Gas
Chapter 7 Market Size and Forecast, By Region, 2021 - 2034 (USD Million & Units)
- 7.1 Key trends
- 7.2 North America
- 7.2.1 U.S.
- 7.2.2 Canada
- 7.3 Europe
- 7.3.1 Russia
- 7.3.2 UK
- 7.3.3 Germany
- 7.3.4 France
- 7.3.5 Spain
- 7.3.6 Austria
- 7.3.7 Italy
- 7.4 Asia Pacific
- 7.4.1 China
- 7.4.2 Australia
- 7.4.3 India
- 7.4.4 Japan
- 7.4.5 South Korea
- 7.4.6 Indonesia
- 7.4.7 Malaysia
- 7.4.8 Thailand
- 7.4.9 Vietnam
- 7.4.10 Philippines
- 7.4.11 Myanmar
- 7.4.12 Bangladesh
- 7.5 Middle East
- 7.5.1 Saudi Arabia
- 7.5.2 UAE
- 7.5.3 Qatar
- 7.5.4 Turkey
- 7.5.5 Iran
- 7.5.6 Oman
- 7.6 Africa
- 7.6.1 Egypt
- 7.6.2 Nigeria
- 7.6.3 Algeria
- 7.6.4 South Africa
- 7.6.5 Angola
- 7.6.6 Kenya
- 7.6.7 Mozambique
- 7.7 Latin America
- 7.7.1 Brazil
- 7.7.2 Mexico
- 7.7.3 Argentina
- 7.7.4 Chile
Chapter 8 Company Profiles
- 8.1 Ashok Leyland
- 8.2 Atlas Copco
- 8.3 Briggs & Stratton
- 8.4 Caterpillar
- 8.5 Cummins
- 8.6 Deere & Company
- 8.7 Generac Power Systems
- 8.8 HIMOINSA
- 8.9 Kirloskar
- 8.10 Mahindra POWEROL
- 8.11 Mitsubishi Heavy Industries
- 8.12 PR INDUSTRIAL
- 8.13 Rapid Power Generation
- 8.14 Rehlko
- 8.15 Rolls-Royce
- 8.16 Scania
- 8.17 Siemens Energy
- 8.18 Volvo Penta
- 8.19 Wartsilä
- 8.20 YANMAR HOLDINGS

