
励磁システムの市場機会、成長促進要因、産業動向分析、2025~2034年予測
Excitation System Market Opportunity, Growth Drivers, Industry Trend Analysis, and Forecast 2025 - 2034- 発行日
- ページ情報
- 英文 123 Pages
- 納期
- 2~3営業日
- 商品コード
- 1750440
- カスタマイズ可能 お客様のご希望に応じて、既存データの加工や未掲載情報(例:国別セグメント)の追加などの対応が可能です。詳細はお問い合わせください。
- 翻訳ツール提供対象 PDF対応AI翻訳ツールの無料貸し出しサービスのご利用が可能です
概要
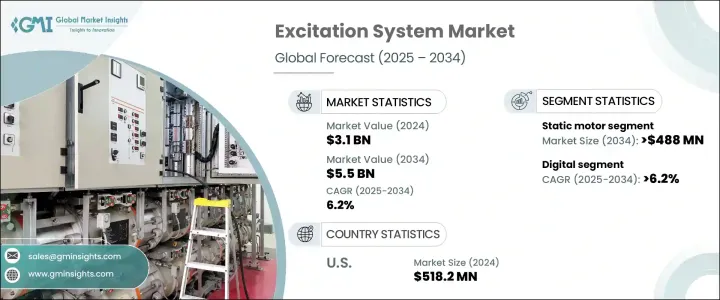
励磁システムの世界市場規模は、2024年に31億米ドルとなり、CAGR 6.2%で成長し、2034年には55億米ドルに達すると予測されています。
この成長には、再生可能エネルギー源への世界の移行が加速していることが背景にあります。電力会社や産業事業者が太陽光発電、風力発電、水力発電の利用を拡大するにつれ、高度なグリッド管理と電圧調整に対する要求が高まっています。励磁システムは、発電機のスムーズな出力制御を可能にし、再生可能エネルギーによる変動に対処するようになった送電網の電力安定性を維持するのに役立つため、こうしたセットアップにおいて重要な役割を果たしています。
市場はまた、エネルギー効率の改善と送電網の信頼性向上を求める広範な動きにも対応しています。先進国と新興国の両方で電力需要が着実に増加しているため、発電所はインフラをアップグレードする必要に迫られています。老朽化したシステムは、より優れた周波数と電圧制御をサポートする高度な励磁技術で近代化されつつあります。これらのシステムは、短時間の停電でも送電網のパフォーマンスに連鎖的な影響を及ぼしかねない、高需要環境では特に重要です。自動化が中心的な焦点となり、最新の励磁システムは、リアルタイムの運転調整をサポートするスマート制御フレームワークへの統合が進んでいます。
| 市場範囲 | |
|---|---|
| 開始年 | 2024 |
| 予測年 | 2025-2034 |
| 開始金額 | 31億米ドル |
| 予測金額 | 55億米ドル |
| CAGR | 6.2% |
インフラの複雑化に伴い、デジタルソリューションの必要性がこれまで以上に高まっています。デジタル励磁システムは、高度な診断、自動化されたシステム応答、SCADAプラットフォームとのシームレスな統合を提供する能力により、好ましい選択肢となりつつあります。これらの機能は、手動介入を減らすだけでなく、より正確なシステムチューニングを可能にし、全体的な効率向上に貢献します。その結果、デジタル技術セグメントは2034年まで6.2%を超えるCAGRを記録すると予想され、進化するグリッドアーキテクチャに沿った次世代制御システムに対する強い需要を示しています。
さまざまなシステムタイプの中で、ブラシレス励磁分野は大きな成長が見込まれ、その市場価値は2034年までに21億米ドルを超えると予想されています。ブラシレス励磁システムは、主にブラシやスリップリングのような消耗しやすい部品が不要になるため、人気を集めています。その結果、メンテナンスの必要性が減り、機器のライフサイクルが長くなるため、ダウンタイムを最小限に抑え、運用コストの削減を目指す大規模発電事業者や産業施設にとって、このシステムは魅力的な選択肢となっています。
市場の勢いは特に北米で顕著であり、米国では引き続き旺盛な需要が見られます。2024年だけでも、米国の励磁システム市場は5億1,820万米ドルとなり、2023年の4億9,860万米ドル、2022年の4億8,060万米ドルから着実に成長しています。米国経済は依然として世界で最も影響力のある国のひとつであり、国内総生産(GDP)は2024年に29兆1,600億米ドルに達します。この経済成長は、エネルギー効率を高め二酸化炭素排出量を削減する全国的な取り組みと相まって、持続可能性の目標に沿った、より新しくスマートな励磁技術の採用を企業に促しています。
より厳格な環境政策と企業のESGイニシアチブは、電力事業者にエネルギー損失の抑制と送電網の性能向上を迫っています。電力消費量が増加し続ける中、企業は現在の性能要求を満たすだけでなく、将来のエネルギー課題にも対応できるシステムを導入する必要に迫られています。発電と配電の中核をなす励磁システムは、この転換の中心にあります。
業界情勢は依然として競合が激しく、世界のメーカーが強い存在感を維持しています。エネルギーとオートメーションにおける数十年の経験に裏打ちされた主要メーカーは、世界市場シェアの20%以上を獲得しています。これらの企業の成功は、技術革新、広範なポートフォリオ、多様なエネルギー・アプリケーションにターンキー・ソリューションを提供する能力に支えられています。これらの企業はR&Dとデジタル変革への投資を続け、励磁システムの未来を形作る役割をさらに確固たるものにしています。
目次
第1章 調査手法と範囲
第2章 エグゼクティブサマリー
第3章 業界考察
- エコシステム分析
- トランプ政権の関税分析
- 貿易への影響
- 貿易量の混乱
- 報復措置
- 業界への影響
- 供給側の影響(原材料)
- 主要原材料の価格変動
- サプライチェーンの再構築
- 生産コストへの影響
- 需要側の影響(販売価格)
- 最終市場への価格伝達
- 市場シェアの動向
- 消費者の反応パターン
- 供給側の影響(原材料)
- 影響を受ける主要企業
- 戦略的な業界対応
- サプライチェーンの再構成
- 価格設定と製品戦略
- 政策関与
- 展望と今後の検討事項
- 貿易への影響
- 規制情勢
- 業界への影響要因
- 促進要因
- 業界の潜在的リスク&課題
- 成長可能性分析
- ポーター分析
- PESTEL分析
第4章 競合情勢
- 戦略的ダッシュボード
- イノベーションと持続可能性の情勢
第5章 市場規模・予測:タイプ別、2021-2034
- 主要動向
- 静止モーター
- ブラシレスモーター
第6章 市場規模・予測:技術別、2021-2034
- 主要動向
- アナログ
- デジタル
第7章 市場規模・予測:用途別、2021-2034
- 主要動向
- 同期発電機
- 同期モーター
第8章 市場規模・予測:最終用途別、2021-2034
- 主要動向
- ユーティリティ
- 産業
第9章 市場規模・予測:地域別、2021-2034
- 主要動向
- 北米
- 米国
- カナダ
- メキシコ
- 欧州
- ドイツ
- イタリア
- フランス
- ロシア
- アジア太平洋地域
- 中国
- インド
- 日本
- オーストラリア
- 韓国
- 中東・アフリカ
- サウジアラビア
- アラブ首長国連邦
- 南アフリカ
- ラテンアメリカ
- ブラジル
- アルゼンチン
第10章 企業プロファイル
- ABB
- ANDRITZ GROUP
- Basler Electric
- Emerson
- F&S Prozessautomation
- General Electric
- Goltens
- JEUMONT Electric
- KinetSync(Kinetics Industries、Inc.)
- Mitsubishi Electric
- NIDEC Corporation
- REIVAX
- Siemens
- VOITH Group
- WEG
目次
The Global Excitation System Market was valued at USD 3.1 billion in 2024 and is estimated to grow at a CAGR of 6.2% to reach USD 5.5 billion by 2034. This growth is fueled by the accelerating global transition toward renewable energy sources. As utilities and industrial operators expand their use of solar, wind, and hydroelectric power, they are facing increasing demands for sophisticated grid management and voltage regulation. Excitation systems play a vital role in these setups, as they enable smooth generator output control, helping maintain power stability in grids that are now dealing with more variability from renewables.
The market is also responding to a broader push for improved energy efficiency and enhanced grid reliability. The steady rise in electricity demand across both industrialized nations and emerging economies is driving power plants to upgrade their infrastructure. Aging systems are being modernized with advanced excitation technologies that support better frequency and voltage control. These systems are especially critical in high-demand environments, where even brief disruptions can have cascading effects on grid performance. Automation has become a central focus, and modern excitation systems are increasingly integrated into smart control frameworks that support real-time operational adjustments.
| Market Scope | |
|---|---|
| Start Year | 2024 |
| Forecast Year | 2025-2034 |
| Start Value | $3.1 Billion |
| Forecast Value | $5.5 Billion |
| CAGR | 6.2% |
With growing infrastructure complexity, the need for digital solutions is more evident than ever. Digital excitation systems are becoming the preferred choice due to their ability to provide advanced diagnostics, automated system responses, and seamless integration with SCADA platforms. These capabilities not only reduce manual intervention but also allow for more precise system tuning, contributing to better overall efficiency. As a result, the digital technology segment is expected to record a CAGR exceeding 6.2% through 2034, indicating strong demand for next-generation control systems that align with evolving grid architectures.
Among the various system types, the brushless excitation segment is projected to see significant growth, with its market value expected to surpass USD 2.1 billion by 2034. Brushless excitation systems are gaining traction primarily because they eliminate components prone to wear and tear, such as brushes and slip rings. This results in reduced maintenance needs and longer equipment life cycles, making these systems an attractive option for large-scale power producers and industrial facilities aiming to minimize downtime and lower operational costs.
The market's momentum is particularly visible in North America, where the United States continues to exhibit strong demand. In 2024 alone, the U.S. excitation system market was valued at USD 518.2 million, growing steadily from USD 498.6 million in 2023 and USD 480.6 million in 2022. The U.S. economy remains one of the most influential on the global stage, with its Gross Domestic Product (GDP) reaching USD 29.16 trillion in 2024. This economic growth, combined with nationwide efforts to enhance energy efficiency and reduce carbon emissions, is pushing enterprises to adopt newer and smarter excitation technologies that align with sustainability goals.
Stricter environmental policies and corporate ESG initiatives are compelling power operators to limit energy loss and improve grid performance. With electricity consumption continuing to rise, companies are under increasing pressure to deploy systems that not only meet current performance demands but also position them for future energy challenges. Excitation systems, as a core part of power generation and distribution, are at the heart of this transition.
The industry landscape remains competitive, with global manufacturers maintaining a strong presence. Key players, backed by decades of experience in energy and automation, have managed to capture more than 20% of the global market share. Their success is anchored in technological innovation, extensive portfolios, and the ability to deliver turnkey solutions for diverse energy applications. These firms continue to invest in R&D and digital transformation, further solidifying their role in shaping the future of excitation systems.
Table of Contents
Chapter 1 Methodology & Scope
- 1.1 Market definitions
- 1.2 Base estimates & calculations
- 1.3 Forecast calculation
- 1.4 Data sources
- 1.4.1 Primary
- 1.4.2 Secondary
- 1.4.2.1 Paid
- 1.4.2.2 Public
Chapter 2 Executive Summary
- 2.1 Industry synopsis, 2021 - 2034
Chapter 3 Industry Insights
- 3.1 Industry ecosystem analysis
- 3.2 Trump administration tariff analysis
- 3.2.1 Impact on trade
- 3.2.1.1 Trade volume disruptions
- 3.2.1.2 Retaliatory measures
- 3.2.2 Impact on the industry
- 3.2.2.1 Supply-side impact (raw materials)
- 3.2.2.1.1 Price volatility in key materials
- 3.2.2.1.2 Supply chain restructuring
- 3.2.2.1.3 Production cost implications
- 3.2.2.2 Demand-side impact (selling price)
- 3.2.2.2.1 Price transmission to end markets
- 3.2.2.2.2 Market share dynamics
- 3.2.2.2.3 Consumer response patterns
- 3.2.2.1 Supply-side impact (raw materials)
- 3.2.3 Key companies impacted
- 3.2.4 Strategic industry responses
- 3.2.4.1 Supply chain reconfiguration
- 3.2.4.2 Pricing and product strategies
- 3.2.4.3 Policy engagement
- 3.2.5 Outlook and future considerations
- 3.2.1 Impact on trade
- 3.3 Regulatory landscape
- 3.4 Industry impact forces
- 3.4.1 Growth drivers
- 3.4.2 Industry pitfalls & challenges
- 3.5 Growth potential analysis
- 3.6 Porter's analysis
- 3.6.1 Bargaining power of suppliers
- 3.6.2 Bargaining power of buyers
- 3.6.3 Threat of new entrants
- 3.6.4 Threat of substitutes
- 3.7 PESTEL analysis
Chapter 4 Competitive Landscape, 2024
- 4.1 Strategic dashboard
- 4.2 Innovation & sustainability landscape
Chapter 5 Market Size and Forecast, By Type, 2021 - 2034 (USD Million)
- 5.1 Key trends
- 5.2 Static motor
- 5.3 Brushless motor
Chapter 6 Market Size and Forecast, By Technology, 2021 - 2034 (USD Million)
- 6.1 Key trends
- 6.2 Analog
- 6.3 Digital
Chapter 7 Market Size and Forecast, By Application, 2021 - 2034 (USD Million)
- 7.1 Key trends
- 7.2 Synchronous generator
- 7.3 Synchronous motor
Chapter 8 Market Size and Forecast, By End Use, 2021 - 2034 (USD Million)
- 8.1 Key trends
- 8.2 Utility
- 8.3 Industrial
Chapter 9 Market Size and Forecast, By Region, 2021 - 2034 (USD Million)
- 9.1 Key trends
- 9.2 North America
- 9.2.1 U.S.
- 9.2.2 Canada
- 9.2.3 Mexico
- 9.3 Europe
- 9.3.1 Germany
- 9.3.2 Italy
- 9.3.3 France
- 9.3.4 Russia
- 9.4 Asia Pacific
- 9.4.1 China
- 9.4.2 India
- 9.4.3 Japan
- 9.4.4 Australia
- 9.4.5 South Korea
- 9.5 Middle East & Africa
- 9.5.1 Saudi Arabia
- 9.5.2 UAE
- 9.5.3 South Africa
- 9.6 Latin America
- 9.6.1 Brazil
- 9.6.2 Argentina
Chapter 10 Company Profiles
- 10.1 ABB
- 10.2 ANDRITZ GROUP
- 10.3 Basler Electric
- 10.4 Emerson
- 10.5 F&S Prozessautomation
- 10.6 General Electric
- 10.7 Goltens
- 10.8 JEUMONT Electric
- 10.9 KinetSync (Kinetics Industries, Inc.)
- 10.10 Mitsubishi Electric
- 10.11 NIDEC Corporation
- 10.12 REIVAX
- 10.13 Siemens
- 10.14 VOITH Group
- 10.15 WEG
- 発行日
- 発行
- Global Market Insights Inc.
- ページ情報
- 英文 123 Pages
- 納期
- 2~3営業日