
網膜電図の市場機会、成長促進要因、産業動向分析、2025年~2034年予測
Electroretinogram Market Opportunity, Growth Drivers, Industry Trend Analysis, and Forecast 2025 - 2034- 発行日
- ページ情報
- 英文 140 Pages
- 納期
- 2~3営業日
- 商品コード
- 1750333
- カスタマイズ可能 お客様のご希望に応じて、既存データの加工や未掲載情報(例:国別セグメント)の追加などの対応が可能です。詳細はお問い合わせください。
- 翻訳ツール提供対象 PDF対応AI翻訳ツールの無料貸し出しサービスのご利用が可能です
概要
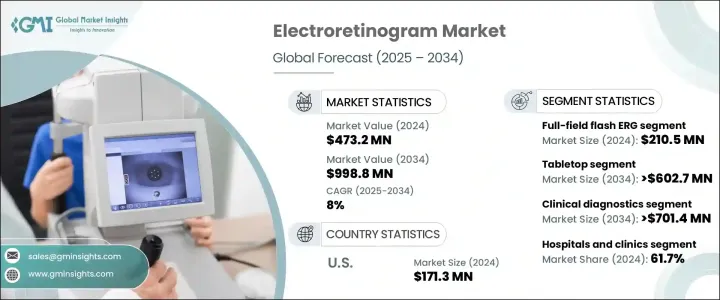
網膜電図の世界市場は、2024年には4億7,320万米ドルとなり、CAGR 8%で成長し、2034年には9億9,880万米ドルに達すると予測されています。
加齢黄斑変性、緑内障、糖尿病性網膜症などの網膜疾患の負担が増加しており、より正確で早期診断ツールの需要が高まっています。世界人口の高齢化に伴い、これらの疾患の罹患率が上昇しており、その結果、臨床現場での網膜電図システムの導入が加速しています。公衆衛生意識の高まりと予防的眼科医療の重視の高まりが市場浸透を後押ししています。ERG検査は眼科医が網膜機能障害を検出することを可能にし、タイムリーな医療介入と患者の転帰改善に貢献します。
網膜電図(ERG)システムの技術的進歩は、市場動向とユーザー普及の再形成において極めて重要な役割を果たしています。ポータブルでバッテリー駆動の機器へのシフトにより、手の届きにくい地域や農村部でも眼科診断を実施することが可能になり、以前はそのような資源がなかった人々へのアクセスが向上し、早期発見が容易になりました。これらのコンパクトなシステムは、現場でのスクリーニング、移動診療、ポイント・オブ・ケア検査に有用であり、世界のヘルスケア・ネットワークでの需要をさらに高めています。可動性に加えて、自動化と統合ソフトウエアの継続的な改善により、ERG検査の効率が大幅に向上しています。自動化されたプロトコル、リアルタイムのデータ処理、直感的なインターフェースは、臨床医のワークフローを合理化し、ヒューマンエラーを減らし、より一貫した信頼性の高い診断結果をもたらしています。この技術的進化は、患者のスループットだけでなく、疾患の進行や治療効果を追跡するために重要な長期的データ管理も改善しています。
| 市場範囲 | |
|---|---|
| 開始年 | 2024年 |
| 予測年 | 2025年~2034年 |
| 開始金額 | 4億7,320万米ドル |
| 予測金額 | 9億9,880万米ドル |
| CAGR | 8% |
卓上型セグメントは、2034年までに6億270万米ドルの売上が見込まれています。この成長軌道は、主にシステムのカスタマイズ可能な構成、優れた解像度、診断ソフトウェアスイートとの統合によって支えられています。様々な臨床環境に適応し、詳細で正確な網膜評価を行うことができるため、複雑な網膜疾患を管理する専門医に選ばれ続けています。
全視野フラッシュERG分野は、2024年に2億1,050万米ドルを生み出しました。これらのシステムは、光受容体の活動を評価し、さまざまな網膜障害を診断するための好ましいモダリティであり続けています。1回の診断で桿体細胞と錐体細胞の機能を評価できるため、眼科の評価には不可欠です。全視野フラッシュERGの効率、スピード、正確性により、予測期間を通じて需要は堅調に推移すると予想されます。
米国の網膜電図市場は2024年に1億7,130万米ドルを生み出し、2034年までCAGR 7.4%で成長すると予測されています。強力なヘルスケアインフラ、慢性網膜疾患の有病率の増加、有利な医療政策が同地域の成長を促進する主な要因です。世界中のヘルスケア施設が先進的な診断技術に投資しており、医療機器メーカーとケアプロバイダーとのパートナーシップが、継続的な技術革新と採用のための強固な基盤を育んでいます。
Diagnosys、LKC Technologies、Konan Medical USA、M&S Technologies、Metrovision、Diopsys、Roland Consultなどの大手企業は、継続的な技術革新と製品の差別化を重視し、存在感を高めています。多くの企業が、先進的なポータブルERGシステムや自動ERGシステムで製品ラインを拡大しています。CSOとVisionは、臨床検証を改善するために研究機関やクリニックと協力しています。戦略的な販売提携や新興市場への進出も、顧客の裾野を広げ、世界の市場シェアを拡大するために優先されています。
目次
第1章 調査手法と範囲
第2章 エグゼクティブサマリー
第3章 業界考察
- エコシステム分析
- 業界への影響要因
- 促進要因
- 網膜疾患の有病率の上昇
- ERGデバイスの技術的進歩
- 高齢化人口の増加
- 病気の早期発見に対する需要の高まり
- 業界の潜在的リスク&課題
- 熟練した専門家の不足
- 限定的な払い戻しポリシー
- 促進要因
- 成長可能性分析
- 規制情勢
- トランプ政権による関税への影響
- 貿易への影響
- 貿易量の混乱
- 国別の対応
- 業界への影響
- 供給側の影響(製造コスト)
- 主要原材料の価格変動
- サプライチェーンの再構築
- 生産コストへの影響
- 需要側の影響(消費者のコスト)
- 最終市場への価格伝達
- 市場シェアの動向
- 消費者の反応パターン
- 供給側の影響(製造コスト)
- 影響を受ける主要企業
- 戦略的な業界対応
- サプライチェーンの再構成
- 価格設定と製品戦略
- 政策関与
- 展望と今後の検討事項
- 貿易への影響
- 価格分析
- テクノロジーの情勢
- ギャップ分析
- ポーター分析
- PESTEL分析
第4章 競合情勢
- イントロダクション
- 企業の市場シェア分析
- 企業マトリックス分析
- 競合ポジショニングマトリックス
- 戦略ダッシュボード
第5章 市場推計・予測:タイプ別、2021年~2034年
- 主要動向
- 全視野フラッシュERG(ffERG)
- パターンERG(PERG)
- 多焦点ERG(mfERG)
第6章 市場推計・予測:製品別、2021年~2034年
- 主要動向
- テーブルトップ
- ハンドヘルド
第7章 市場推計・予測:用途別、2021年~2034年
- 主要動向
- 臨床診断
- 研究
第8章 市場推計・予測:最終用途別、2021年~2034年
- 主要動向
- 病院と診療所
- 眼科センター
- 研究機関
第9章 市場推計・予測:地域別、2021年~2034年
- 主要動向
- 北米
- 米国
- カナダ
- 欧州
- ドイツ
- 英国
- フランス
- スペイン
- イタリア
- オランダ
- アジア太平洋
- 中国
- 日本
- インド
- オーストラリア
- 韓国
- ラテンアメリカ
- ブラジル
- メキシコ
- アルゼンチン
- 中東・アフリカ
- 南アフリカ
- サウジアラビア
- アラブ首長国連邦
第10章 企業プロファイル
- an-vision
- ChongQing SunKingdom Medical
- CSO
- Diagnosys
- Diopsys
- Electro-Diagnostic Imaging
- Konan Medical USA
- LKC Technologies
- M&S Technologies
- Metrovision
- Roland Consult Stasche &Finger
目次
The Global Electroretinogram Market was valued at USD 473.2 million in 2024 and is estimated to grow at a CAGR of 8% to reach USD 998.8 million by 2034, driven by the increasing burden of retinal conditions, including age-related macular degeneration, glaucoma, and diabetic retinopathy, that fuel demand for more accurate and early diagnostic tools. As the global population ages, the incidence of these diseases is rising, which in turn is accelerating the adoption of electroretinogram systems across clinical settings. Rising public health awareness and the growing emphasis on preventive eye care boost market penetration. ERG testing allows ophthalmologists to detect retinal dysfunction, helping ensure timely medical intervention and better patient outcomes.
Technological advancements in electroretinogram (ERG) systems have played a pivotal role in reshaping market trends and user adoption. The shift toward portable, battery-operated devices has made it feasible to deliver ophthalmic diagnostics in hard-to-reach or rural areas, increasing accessibility and facilitating early detection in populations that previously lacked such resources. These compact systems are useful for on-site screenings, mobile clinics, and point-of-care testing, further fueling their demand across global healthcare networks. In addition to mobility, ongoing improvements in automation and integrated software are significantly enhancing the efficiency of ERG procedures. Automated protocols, real-time data processing, and intuitive interfaces are streamlining workflows for clinicians, reducing human error, and delivering more consistent and reliable diagnostic outcomes. This technological evolution is improving not only patient throughput but also long-term data management, which is crucial for tracking disease progression and treatment efficacy.
| Market Scope | |
|---|---|
| Start Year | 2024 |
| Forecast Year | 2025-2034 |
| Start Value | $473.2 Million |
| Forecast Value | $998.8 Million |
| CAGR | 8% |
The tabletop segment is expected to generate USD 602.7 million by 2034. This growth trajectory is primarily supported by the systems' customizable configurations, superior resolution, and integration with diagnostic software suites. Their adaptability to various clinical environments, along with the ability to produce detailed and accurate retinal assessments, ensures they remain the preferred choice for specialists managing complex retinal disorders.
The full-field flash ERG segment generated USD 210.5 million in 2024. These systems remain the preferred modality for evaluating photoreceptor activity and diagnosing a wide array of retinal disorders. Their ability to assess rod and cone cell function in a single diagnostic session makes them indispensable for ophthalmic evaluations. The efficiency, speed, and accuracy of full-field flash ERGs are expected to keep demand robust throughout the forecast timeline.
U.S. Electroretinogram Market generated USD 171.3 million in 2024 and is forecasted to grow at a CAGR of 7.4% through 2034. A strong healthcare infrastructure, increased prevalence of chronic retinal diseases, and favorable health policies are major factors propelling growth in the region. Healthcare facilities worldwide are investing in advanced diagnostic technologies, and partnerships between medical device manufacturers and care providers are fostering a strong foundation for continued innovation and adoption.
Leading players such as Diagnosys, LKC Technologies, Konan Medical USA, M&S Technologies, Metrovision, Diopsys, and Roland Consult emphasize continuous innovation and product differentiation to boost their presence. Many companies are expanding their product lines with advanced portable and automated ERG systems. CSO and Vision collaborate with research institutes and clinics to improve clinical validation. Strategic distribution partnerships and expansion into emerging markets are also prioritized to broaden customer reach and increase global market share.
Table of Contents
Chapter 1 Methodology and Scope
- 1.1 Market scope and definitions
- 1.2 Research design
- 1.2.1 Research approach
- 1.2.2 Data collection methods
- 1.3 Base estimates and calculations
- 1.3.1 Base year calculation
- 1.3.2 Key trends for market estimation
- 1.4 Forecast model
- 1.5 Primary research and validation
- 1.5.1 Primary sources
- 1.5.2 Data mining sources
Chapter 2 Executive Summary
- 2.1 Industry 3600 synopsis
Chapter 3 Industry Insights
- 3.1 Industry ecosystem analysis
- 3.2 Industry impact forces
- 3.2.1 Growth drivers
- 3.2.1.1 Rising prevalence of retinal disorders
- 3.2.1.2 Technological advancements in ERG devices
- 3.2.1.3 Growing geriatric population
- 3.2.1.4 Rising demand for early disease detection
- 3.2.2 Industry pitfalls and challenges
- 3.2.2.1 Lack of skilled professionals
- 3.2.2.2 Limited reimbursement policies
- 3.2.1 Growth drivers
- 3.3 Growth potential analysis
- 3.4 Regulatory landscape
- 3.5 Trump administration tariffs
- 3.5.1 Impact on trade
- 3.5.1.1 Trade volume disruptions
- 3.5.1.2 Country-wise response
- 3.5.2 Impact on the industry
- 3.5.2.1 Supply-side impact (Cost of manufacturing)
- 3.5.2.1.1 Price volatility in key materials
- 3.5.2.1.2 Supply chain restructuring
- 3.5.2.1.3 Production cost implications
- 3.5.2.2 Demand-side impact (Cost to consumers)
- 3.5.2.2.1 Price transmission to end markets
- 3.5.2.2.2 Market share dynamics
- 3.5.2.2.3 Consumer response patterns
- 3.5.2.1 Supply-side impact (Cost of manufacturing)
- 3.5.3 Key companies impacted
- 3.5.4 Strategic industry responses
- 3.5.4.1 Supply chain reconfiguration
- 3.5.4.2 Pricing and product strategies
- 3.5.4.3 Policy engagement
- 3.5.5 Outlook and future considerations
- 3.5.1 Impact on trade
- 3.6 Pricing analysis
- 3.7 Technology landscape
- 3.8 Gap analysis
- 3.9 Porter's analysis
- 3.10 PESTEL analysis
Chapter 4 Competitive Landscape, 2024
- 4.1 Introduction
- 4.2 Company market share analysis
- 4.3 Company matrix analysis
- 4.4 Competitive positioning matrix
- 4.5 Strategy dashboard
Chapter 5 Market Estimates and Forecast, By Type, 2021 - 2034 ($ Mn and Units)
- 5.1 Key trends
- 5.2 Full-field flash ERG (ffERG)
- 5.3 Pattern ERG (PERG)
- 5.4 Multifocal ERG (mfERG)
Chapter 6 Market Estimates and Forecast, By Product, 2021 - 2034 ($ Mn and Units)
- 6.1 Key trends
- 6.2 Tabletop
- 6.3 Handheld
Chapter 7 Market Estimates and Forecast, By Application, 2021 - 2034 ($ Mn)
- 7.1 Key trends
- 7.2 Clinical diagnostics
- 7.3 Research
Chapter 8 Market Estimates and Forecast, By End Use, 2021 - 2034 ($ Mn)
- 8.1 Key trends
- 8.2 Hospitals and clinics
- 8.3 Ophthalmic centers
- 8.4 Research institutes
Chapter 9 Market Estimates and Forecast, By Region, 2021 - 2034 ($ Mn and Units)
- 9.1 Key trends
- 9.2 North America
- 9.2.1 U.S.
- 9.2.2 Canada
- 9.3 Europe
- 9.3.1 Germany
- 9.3.2 UK
- 9.3.3 France
- 9.3.4 Spain
- 9.3.5 Italy
- 9.3.6 Netherlands
- 9.4 Asia Pacific
- 9.4.1 China
- 9.4.2 Japan
- 9.4.3 India
- 9.4.4 Australia
- 9.4.5 South Korea
- 9.5 Latin America
- 9.5.1 Brazil
- 9.5.2 Mexico
- 9.5.3 Argentina
- 9.6 Middle East and Africa
- 9.6.1 South Africa
- 9.6.2 Saudi Arabia
- 9.6.3 UAE
Chapter 10 Company Profiles
- 10.1 an-vision
- 10.2 ChongQing SunKingdom Medical
- 10.3 CSO
- 10.4 Diagnosys
- 10.5 Diopsys
- 10.6 Electro-Diagnostic Imaging
- 10.7 Konan Medical USA
- 10.8 LKC Technologies
- 10.9 M&S Technologies
- 10.10 Metrovision
- 10.11 Roland Consult Stasche & Finger
- 発行日
- 発行
- Global Market Insights Inc.
- ページ情報
- 英文 140 Pages
- 納期
- 2~3営業日


