
CaaS(Carpool-as-a-Service)の市場機会、成長促進要因、産業動向分析、2025年~2034年予測
Carpool-as-a-Service Market Opportunity, Growth Drivers, Industry Trend Analysis, and Forecast 2025 - 2034- 発行日
- ページ情報
- 英文 190 Pages
- 納期
- 2~3営業日
- 商品コード
- 1750307
- カスタマイズ可能 お客様のご希望に応じて、既存データの加工や未掲載情報(例:国別セグメント)の追加などの対応が可能です。詳細はお問い合わせください。
- 翻訳ツール提供対象 PDF対応AI翻訳ツールの無料貸し出しサービスのご利用が可能です
概要
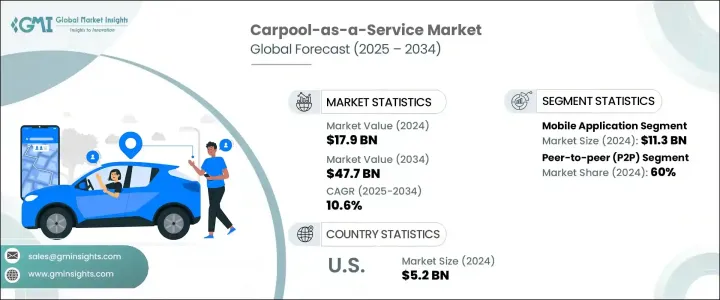
CaaS(Carpool-as-a-Service)の世界市場規模は、2024年に179億米ドルとなり、CAGR 10.6%で成長し、2034年には477億米ドルに達すると推定されます。
同市場は、都市部の混雑の増加、環境維持に対する意識の高まり、手頃な価格の共有交通ソリューションへの嗜好の高まりに後押しされ、力強い勢いを見せています。都市のデジタル化が進み、持続可能性が第一の目標になるにつれ、相乗りは民間事業者、自治体の輸送、企業のモビリティプログラムによって複合交通システムに統合されつつあります。このような統合は、交通渋滞、燃料消費、通勤コストといった重要な課題に取り組むと同時に、今日のモビリティユーザーの進化するニーズにも対応しています。
CaaSの需要は、日常的な通勤、従業員のシャトルバス、長距離移動、イベント時の移動など、さまざまな使用事例で拡大しています。アプリベースの予約、即時のライドマッチング、最適化されたルーティングの利便性により、相乗りは一人乗りの自動車利用に代わる実行可能で魅力的な選択肢として位置づけられています。企業は、従業員の移動手段を改善し、車両管理の負担を軽減し、環境、社会、ガバナンス(ESG)のコミットメントに沿うために、これらのプラットフォームを採用しています。労働者、学生、都市居住者の間で広く普及している乗り合いの魅力は、都市中心部と拡大する郊外地域の両方で、日常的な採用を支え続けています。
| 市場範囲 | |
|---|---|
| 開始年 | 2024年 |
| 予測年 | 2025~2034年 |
| 開始金額 | 179億米ドル |
| 予測金額 | 477億米ドル |
| CAGR | 10.6% |
先進技術は、CaaSの開発を可能にする重要な要素です。人工知能、GPS追跡、リアルタイムのルートマッピング、アプリ内決済、アルゴリズムベースのライドマッチングにおける革新は、サービス効率と顧客満足度を向上させています。これらのソリューションは、より広範なMaaS(Mobility-as-a-Service)プラットフォームに統合され、相乗りをデジタルウォレット、リアルタイムの公共交通データ、スマートシティインフラにリンクさせています。このレベルの相互運用性は、完全に接続された都市交通エコシステムの構築に不可欠です。
プラットフォームの観点から、市場はモバイルアプリケーション、ハイブリッドシステム、ウェブベースに区分されます。モバイルアプリケーションが市場をリードし、2024年の売上は約113億米ドルに達しました。このセグメントの優位性は、スマートフォン利用の増加、モバイルインターネットへのアクセスの普及、リアルタイムのライドシェアリングソリューションに対する需要の高まりによって後押しされています。これらのアプリケーションは、ユーザーフレンドリーなインターフェースを提供し、ライドスケジューリング、ライブトラッキング、デジタル決済などの機能への便利なアクセスを記載しています。サービスプロバイダは、パーソナライズされた通知、位置特定サービス、スムーズなナビゲーションを通じてユーザーエンゲージメントを向上させるモバイル中心の戦略に注力しており、これらすべてがロイヤルティとユーザー保持を強化しています。また、モバイルアプリはコネクテッドカーシステムや音声アシスタントと統合され、ハンズフリーでの対話、リアルタイムの交通状況の把握、ニーズに合わせた通勤の提案などを可能にしています。さらに、モバイルファーストモデルは、最小限のインフラ要件で迅速な拡大を可能にするため、プロバイダは効率的にサービスを開始し、規模を拡大することができます。
市場はまた、ピアツーピア(P2P)、B2C、その他のモデルにタイプ別に区分されます。2024年には、P2Pセグメントが60%と最大のシェアを占めます。このセグメントの成長は、デジタルプラットフォームを通じて自家用車の所有者と乗客を直接つなぐ分散型ライドシェアリングネットワークへの関心の高まりに支えられています。この仕組みは、諸経費を削減し、柔軟性を提供し、個人が所有する車両の遊休容量を収益化することを可能にします。コスト削減を求める毎日の通勤者や、副収入を求めるドライバーに魅力的です。P2Pプラットフォームは、インテリジェント乗車マッチング、安全な決済、アプリ内での直接コミュニケーションなどの機能を備えており、ユーザーの信頼性を高め、乗車調整を簡素化します。都心部の成長と通勤需要の増加に伴い、P2Pサービスは、特に学生、フリーランサー、都市部の専門職の間で人気を集め続けています。
ビジネスモデルの観点から見ると、CaaS市場にはコミッションベースモデル、サブスクリプションベース、フリーミアム、その他の収益戦略があります。手数料ベースのモデルは、各乗車完了のパーセンテージをプラットフォームが獲得できるスケーラブルな構造であるため、2024年の市場を独占しました。このモデルは、最小限の先行投資で成長をサポートするため、ユーザーとプロバイダの双方にとって魅力的です。このモデルは、高価なオンボーディングやフリート投資を必要とせず、カジュアルユーザーやパートタイムドライバーの幅広い参加を促します。この仕組みは、シンプルで運用コストが低く、さまざまな市場に適応できるため、特に資産に依存しないフレームワークで運営されるプラットフォームで広く利用されています。
用途別では、日常通勤、長距離移動、空港送迎、イベント型旅行、その他に分けられます。毎日の通勤は2024年に主要セグメントとして浮上し、最も高い収益シェアを占めました。このセグメントは、都市の混雑が悪化し、燃料価格が上昇し、消費者がエコフレンドリー通勤手段を意識するようになるにつれて拡大しています。相乗りは交通渋滞の緩和、排出ガスの削減、通勤費の削減に役立ちます。専門職、学生、ギグワーカーなどのユーザーは、特に車両密度が高く駐車場が限られている都市で、定期的にこうしたサービスを利用しています。GPSを利用したルート計画やモバイル決済などの機能は、特にピーク時の信頼性を向上させています。企業や機関は、インセンティブを提供したり、社内のモビリティシステムにシェアライドを組み込んだりして、日常的な相乗りを推進するようになっています。
地域別では、米国が北米市場をリードし、2024年には52億米ドルを生み出し、予測期間中のCAGRは10.9%と予測されます。米国の成長を牽引しているのは、スマートフォンの高い普及率、確立されたデジタルインフラ、通勤人口の多さです。全米の主要都市は日々の交通課題に直面しており、代替交通ソリューションに対する強い需要が生まれています。先進的デジタルソリューションを提供する複数のサービスプロバイダの存在も、普及を後押ししています。サステイナブル輸送を奨励する政府の施策は、相乗りレーンへのアクセスや共有車両の通行料減免と相まって、CaaS利用をさらに後押ししています。各社がクラウドベースのシステム、予測分析、AI主導のツールに投資を続け、利用者の体験、業務効率、環境パフォーマンスを高めているため、市場は急速に進化しています。
目次
第1章 調査手法と範囲
第2章 エグゼクティブサマリー
第3章 産業考察
- エコシステム分析
- サプライヤーの情勢
- 原料供給者
- 部品供給業者
- 製造業者
- 技術プロバイダ
- 流通チャネル分析
- 最終用途
- 利益率分析
- サプライヤーの情勢
- トランプ政権による関税への影響
- 貿易への影響
- 貿易量の混乱
- 報復措置
- 産業への影響
- 供給側の影響(原料)
- 主要原料の価格変動
- サプライチェーンの再構築
- 生産コストへの影響
- 需要側の影響(販売価格)
- 最終市場への価格伝達
- 市場シェアの動向
- 消費者の反応パターン
- 供給側の影響(原料)
- 戦略的な産業対応
- サプライチェーンの再構成
- 価格設定と製品戦略
- 貿易への影響
- 技術とイノベーションの情勢
- 特許分析
- 規制情勢
- コスト内訳分析
- 主要ニュースと取り組み
- 影響要因
- 促進要因
- 都市の混雑と汚染の削減
- 政府の支援と施策推進
- ユーザーのコスト削減
- 技術とプラットフォームの成熟度
- 産業の潜在的リスク・課題
- 低い占有率と信頼性の問題
- ユーザーの信頼と安全性に関する懸念
- 促進要因
- 成長可能性分析
- ポーター分析
- PESTEL分析
第4章 競合情勢
- イントロダクション
- 企業の市場シェア分析
- 競合ポジショニングマトリックス
- 戦略的展望マトリックス
第5章 市場推定・予測:ビジネスモデル別、2021~2034年
- 主要動向
- コミッションベースモデル
- サブスクリプションベースモデル
- フリーミアムモデル
- その他
第6章 市場推定・予測:プラットフォーム別、2021~2034年
- 主要動向
- モバイルアプリケーション
- ハイブリッド
- ウェブベース
第7章 市場推定・予測:タイプ別、2021~2034年
- 主要動向
- ピアツーピア(P2P)
- B2C
- その他
第8章 市場推定・予測:用途別、2021~2034年
- 主要動向
- 日常通勤
- 長距離旅行
- 空港送迎
- イベント型旅行
- その他
第9章 市場推定・予測:地域別、2021~2034年
- 主要動向
- 北米
- 米国
- カナダ
- 欧州
- ドイツ
- フランス
- 英国
- スペイン
- イタリア
- ロシア
- 北欧諸国
- アジア太平洋
- 中国
- インド
- 日本
- 韓国
- オーストラリア・ニュージーランド
- 東南アジア
- ラテンアメリカ
- ブラジル
- メキシコ
- アルゼンチン
- 中東・アフリカ
- アラブ首長国連邦
- 南アフリカ
- サウジアラビア
第10章 企業プロファイル
- Berymo
- BlaBlaCar
- Carma
- DiDi
- Getaround
- Gojek Tech
- Grab.
- Liftshare
- Lyft
- Motar
- Ola Cabs
- Poparide
- Quick Ride
- Scoop
- Splt
- Trempy
- Uber
- Via.
- Waze Carpool
- Zimride
目次
The Global Carpool-As-A-Service (CaaS) Market was valued at USD 17.9 billion in 2024 and is estimated to grow at a CAGR of 10.6% to reach USD 47.7 billion by 2034. The market is experiencing robust momentum, propelled by increasing urban congestion, heightened awareness of environmental sustainability, and a growing preference for affordable, shared transportation solutions. As cities become more digitally connected and sustainability becomes a primary objective, carpooling is being integrated into multimodal transport systems by private operators, municipal transit agencies, and corporate mobility programs. This integration is addressing key challenges such as traffic congestion, fuel consumption, and commuting costs while meeting the evolving needs of today's mobility users.
Demand for CaaS is expanding across various use cases, including routine commuting, employee shuttles, long-haul rides, and transportation for events. The convenience of app-based bookings, instant ride-matching, and optimized routing has positioned carpooling as a viable and attractive alternative to single-occupancy vehicle use. Businesses are adopting these platforms to improve employee transportation, reduce fleet management burdens, and align with environmental, social, and governance (ESG) commitments. The widespread appeal of shared rides among workers, students, and city dwellers continues to support daily adoption in both urban centers and expanding suburban regions.
| Market Scope | |
|---|---|
| Start Year | 2024 |
| Forecast Year | 2025-2034 |
| Start Value | $17.9 Billion |
| Forecast Value | $47.7 Billion |
| CAGR | 10.6% |
Advanced technology is a key enabler in the development of CaaS. Innovations in artificial intelligence, GPS tracking, real-time route mapping, in-app payments, and algorithm-based ride matching are driving service efficiency and customer satisfaction. These solutions are being integrated into broader mobility-as-a-service (MaaS) platforms, linking carpooling to digital wallets, real-time public transit data, and smart city infrastructure. This level of interoperability is critical for building a fully connected urban transport ecosystem.
In terms of platforms, the market is segmented into mobile applications, hybrid systems, and web-based solutions. Mobile applications led the market, with revenue reaching approximately USD 11.3 billion in 2024. The dominance of this segment is fueled by increasing smartphone usage, widespread mobile internet access, and growing demand for real-time ride-sharing solutions. These applications offer a user-friendly interface and convenient access to features like ride scheduling, live tracking, and digital payments. Service providers are focusing on mobile-centric strategies that improve user engagement through personalized notifications, location-specific services, and smooth navigation, all of which enhance loyalty and user retention. Mobile apps also integrate with connected vehicle systems and voice assistants, allowing for hands-free interaction, real-time traffic insights, and tailored commuting suggestions. Additionally, the mobile-first model enables rapid expansion with minimal infrastructure requirements, allowing providers to launch and scale efficiently.
The market is also segmented by type into peer-to-peer (P2P), business-to-consumer (B2C), and other models. The P2P segment accounted for the largest share at 60% in 2024. The growth of this segment is underpinned by rising interest in decentralized ride-sharing networks that connect private vehicle owners with passengers directly through digital platforms. This arrangement reduces overhead, offers flexibility, and allows individuals to monetize their vehicle's idle capacity. It appeals to daily commuters seeking cost savings and drivers looking for extra income. P2P platforms come equipped with features such as intelligent ride matching, secure payments, and direct in-app communication, which strengthen user confidence and simplify ride coordination. As urban centers grow and commuting demand increases, P2P services continue to gain popularity, especially among students, freelancers, and urban professionals.
From a business model standpoint, the CaaS market includes commission-based, subscription-based, freemium, and other revenue strategies. The commission-based model dominated the market in 2024 due to its scalable structure that allows platforms to earn a percentage of each completed ride. This model supports growth with minimal upfront investment, making it attractive for both users and providers. It encourages broad participation from casual users and part-time drivers without the need for expensive onboarding or fleet investments. The structure is widely used due to its simplicity, low operational costs, and adaptability across different markets, especially for platforms that operate with asset-light frameworks.
By application, the market is divided into daily commuting, long-distance travel, airport transfers, event-based travel, and others. Daily commuting emerged as the leading segment in 2024, accounting for the highest revenue share. This segment is expanding as urban congestion worsens, fuel prices rise, and consumers become more conscious of eco-friendly commuting alternatives. Carpooling helps reduce traffic pressure, cut emissions, and lower commuting expenses. Users such as professionals, students, and gig workers regularly rely on these services, especially in cities with high vehicle density and limited parking. Features like GPS-assisted route planning and mobile payments improve reliability, particularly during peak hours. Businesses and institutions are increasingly promoting daily carpooling by offering incentives and integrating shared rides into internal mobility systems.
Regionally, the United States led the North American market, generating USD 5.2 billion in 2024 and projected to grow at a CAGR of 10.9% during the forecast period. Growth in the U.S. is driven by high smartphone adoption, established digital infrastructure, and a large commuting population. Major cities across the country face daily traffic challenges, creating strong demand for alternative transit solutions. The presence of multiple service providers offering advanced digital solutions also supports widespread adoption. Government policies encouraging sustainable transportation, combined with access to carpool lanes and reduced tolls for shared vehicles, further incentivize CaaS usage. The market is evolving rapidly as companies continue to invest in cloud-based systems, predictive analytics, and AI-driven tools that enhance rider experience, operational efficiency, and environmental performance.
Table of Contents
Chapter 1 Methodology & Scope
- 1.1 Research design
- 1.1.1 Research approach
- 1.1.2 Data collection methods
- 1.2 Base estimates & calculations
- 1.2.1 Base year calculation
- 1.2.2 Key trends for market estimation
- 1.3 Forecast model
- 1.4 Primary research and validation
- 1.4.1 Primary sources
- 1.4.2 Data mining sources
- 1.5 Market scope & definition
Chapter 2 Executive Summary
- 2.1 Industry 3600 synopsis, 2021 - 2034
Chapter 3 Industry Insights
- 3.1 Industry ecosystem analysis
- 3.1.1 Supplier landscape
- 3.1.1.1 Raw material providers
- 3.1.1.2 Component providers
- 3.1.1.3 Manufacturers
- 3.1.1.4 Technology providers
- 3.1.1.5 Distribution channel analysis
- 3.1.1.6 End use
- 3.1.2 Profit margin analysis
- 3.1.1 Supplier landscape
- 3.2 Impact of Trump administration tariffs
- 3.2.1 Impact on trade
- 3.2.1.1 Trade volume disruptions
- 3.2.1.2 Retaliatory measures
- 3.2.2 Impact on industry
- 3.2.2.1 Supply-side impact (raw materials)
- 3.2.2.1.1 Price volatility in key materials
- 3.2.2.1.2 Supply chain restructuring
- 3.2.2.1.3 Production cost implications
- 3.2.2.2 Demand-side impact (selling price)
- 3.2.2.2.1 Price transmission to end markets
- 3.2.2.2.2 Market share dynamics
- 3.2.2.2.3 Consumer response patterns
- 3.2.2.1 Supply-side impact (raw materials)
- 3.2.3 Strategic industry responses
- 3.2.3.1 Supply chain reconfiguration
- 3.2.3.2 Pricing and product strategies
- 3.2.1 Impact on trade
- 3.3 Technology & innovation landscape
- 3.4 Patent analysis
- 3.5 Regulatory landscape
- 3.6 Cost breakdown analysis
- 3.7 Key news & initiatives
- 3.8 Impact forces
- 3.8.1 Growth drivers
- 3.8.1.1 Urban congestion and pollution reduction
- 3.8.1.2 Government support and policy push
- 3.8.1.3 Cost savings for users
- 3.8.1.4 Technology and platform maturity
- 3.8.2 Industry pitfalls & challenges
- 3.8.2.1 Low occupancy and reliability issues
- 3.8.2.2 User trust and safety concerns
- 3.8.1 Growth drivers
- 3.9 Growth potential analysis
- 3.10 Porter's analysis
- 3.11 PESTEL analysis
Chapter 4 Competitive Landscape, 2024
- 4.1 Introduction
- 4.2 Company market share analysis
- 4.3 Competitive positioning matrix
- 4.4 Strategic outlook matrix
Chapter 5 Market Estimates & Forecast, By Business Model, 2021 - 2034 ($Bn)
- 5.1 Key trends
- 5.2 Commission-Based model
- 5.3 Subscription-Based model
- 5.4 Freemium model
- 5.5 Others
Chapter 6 Market Estimates & Forecast, By Platform, 2021 - 2034 ($Bn)
- 6.1 Key trends
- 6.2 Mobile application
- 6.3 Hybrid
- 6.4 Web-based platform
Chapter 7 Market Estimates & Forecast, By Type, 2021 - 2034 ($Bn)
- 7.1 Key trends
- 7.2 Peer-to-Peer (P2P)
- 7.3 Business-to-Consumer (B2C)
- 7.4 Others
Chapter 8 Market Estimates & Forecast, By Application, 2021 - 2034 ($Bn)
- 8.1 Key trends
- 8.2 Daily commuting
- 8.3 Long-Distance travel
- 8.4 Airport transfers
- 8.5 Event-Based travel
- 8.6 Others
Chapter 9 Market Estimates & Forecast, By Region, 2021 - 2034 ($Bn, Units)
- 9.1 Key trends
- 9.2 North America
- 9.2.1 U.S.
- 9.2.2 Canada
- 9.3 Europe
- 9.3.1 Germany
- 9.3.2 France
- 9.3.3 UK
- 9.3.4 Spain
- 9.3.5 Italy
- 9.3.6 Russia
- 9.3.7 Nordics
- 9.4 Asia Pacific
- 9.4.1 China
- 9.4.2 India
- 9.4.3 Japan
- 9.4.4 South Korea
- 9.4.5 ANZ
- 9.4.6 Southeast Asia
- 9.5 Latin America
- 9.5.1 Brazil
- 9.5.2 Mexico
- 9.5.3 Argentina
- 9.6 MEA
- 9.6.1 UAE
- 9.6.2 South Africa
- 9.6.3 Saudi Arabia
Chapter 10 Company Profiles
- 10.1 Berymo
- 10.2 BlaBlaCar
- 10.3 Carma
- 10.4 DiDi
- 10.5 Getaround
- 10.6 Gojek Tech
- 10.7 Grab.
- 10.8 Liftshare
- 10.9 Lyft
- 10.10 Motar
- 10.11 Ola Cabs
- 10.12 Poparide
- 10.13 Quick Ride
- 10.14 Scoop
- 10.15 Splt
- 10.16 Trempy
- 10.17 Uber
- 10.18 Via.
- 10.19 Waze Carpool
- 10.20 Zimride
- 発行日
- 発行
- Global Market Insights Inc.
- ページ情報
- 英文 190 Pages
- 納期
- 2~3営業日

