
レモングラスオイルの市場機会、成長促進要因、産業動向分析、2025年~2034年予測
Lemongrass Oil Market Opportunity, Growth Drivers, Industry Trend Analysis, and Forecast 2025 - 2034- 発行日
- ページ情報
- 英文 220 Pages
- 納期
- 2~3営業日
- 商品コード
- 1741020
- カスタマイズ可能 お客様のご希望に応じて、既存データの加工や未掲載情報(例:国別セグメント)の追加などの対応が可能です。詳細はお問い合わせください。
- 翻訳ツール提供対象 PDF対応AI翻訳ツールの無料貸し出しサービスのご利用が可能です
概要
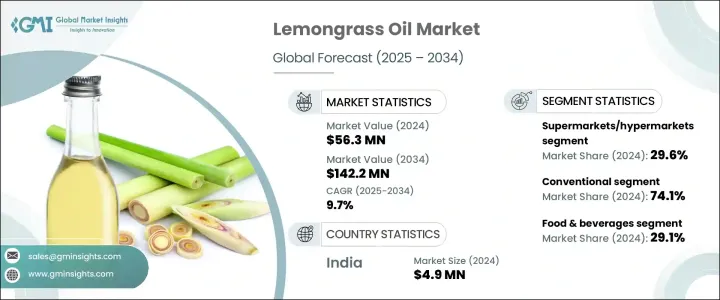
レモングラスオイルの世界市場は、2024年には5,630万米ドルと評価され、化粧品やパーソナルケア製品におけるレモングラスオイルの人気の高まりにより、CAGR 9.7%で成長し、2034年には1億4,220万米ドルに達すると予測されています。
オーガニックや植物由来の成分に対する消費者の需要が高まる中、レモングラスオイルはスキンケア、ボディケア、ヘアケア製品に求められる成分となっています。クリーンビューティームーブメントの高まりや、化学物質を使用しない代替品への動向が、この需要に拍車をかけ、大手化粧品会社がレモングラスオイルを製品ラインに組み込むことを後押ししています。
クレンジング、化粧水、保湿剤などの美容製品へのレモングラスオイルの使用は拡大しています。オイルは、過剰な皮脂分泌をコントロールし、ニキビを減らし、肌を若返らせる能力で知られています。その抗酸化作用は、フリーラジカルから肌を守るアンチエイジング製品にも活用されています。ヘアケアでは、頭皮に栄養を与え、フケを防ぎ、髪を丈夫にする効果があるため、シャンプーやコンディショナーによく使われています。さらに、その爽やかな柑橘系の香りから、ボディソープやデオドラント剤の成分としても人気があります。このような植物由来の美容製品に対する消費者の嗜好の高まりが、市場の成長を後押ししています。
| 市場範囲 | |
|---|---|
| 開始年 | 2024 |
| 予測年 | 2025-2034 |
| 開始金額 | 5,630万米ドル |
| 予測金額 | 1億4,220万米ドル |
| CAGR | 9.7% |
市場は慣行タイプと有機タイプに分けられ、2024年のシェアは慣行タイプが74.1%を占める。慣行型はより広く入手可能で、伝統的な農法で生産されます。化粧品、食品、医薬品、アロマセラピーなど様々な産業で利用されています。インド、中国、インドネシアなどの国が生産をリードしており、その強固なサプライチェーンがレモングラスオイルの世界の供給を保証しています。シトラールの含有量が高いため、香料、防虫剤、食品香料として好まれ、広く使用されています。
飲食品業界は依然としてレモングラスオイルの最大消費者で、29.1%のシェアを占めており、急拡大している医薬品業界が僅差で続いています。レモングラスオイルは抗菌作用があり、ハーブティー、スープ、ソース、菓子類など様々な食品に理想的な添加物として珍重されています。柑橘系の風味だけでなく、消化促進効果や抗酸化作用もあるため、飲食品として人気が高まっています。より多くの消費者が天然素材や健康増進素材を求める中、レモングラスオイルの料理や健康食品への汎用性は、同分野での需要を牽引し続けています。
インドのレモングラスオイル市場は2024年に490万米ドルを創出、インドは主要な石油生産国です。米国と欧州諸国はレモングラスオイルの最大の輸入国であり、世界需要の大きなシェアを占めています。これらの地域は、エッセンシャルオイル抽出のためにレモングラスが栽培されている熱帯諸国に大きく依存しています。レモングラスオイルの世界の需要は、この万能オイルが料理やウェルネス製品に役立つことが国際市場で認識され、成長を続けています。市場の拡大に伴い、インドをはじめとする生産国は、世界の需要の増加に対応する態勢を整え、レモングラスオイルの世界のサプライチェーンにおける地位をさらに強固なものにしています。
レモングラスオイル業界の主要企業には、ヤング・リヴィング・エッセンシャルオイル(Young Living Essential Oils)、エデンズ・ガーデン(Edens Garden)、マウンテン・ローズ・ハーブ(Mountain Rose Herbs)、ナウ・フーズ(NOW Foods)、オーラ・カシア(Aura Cacia)などがあります。これらの企業は、製品の革新、世界的プレゼンスの拡大、レモングラスオイルの利点に関する消費者教育の強化に注力しています。また、持続可能な農法を模索し、サプライヤーと戦略的パートナーシップを築き、オーガニックや環境に優しい製品に対する消費者の需要の高まりに応えるべく、製品の充実を図っています。
目次
第1章 調査手法と範囲
第2章 エグゼクティブサマリー
第3章 業界考察
- エコシステム分析
- バリューチェーンに影響を与える要因
- 利益率分析
- ディスラプション
- 将来の展望
- 製造業者
- 販売代理店
- サプライヤーの情勢
- 利益率分析
- トランプ政権による関税への影響
- 貿易への影響
- 貿易量の混乱
- 報復措置
- 業界への影響
- 供給側の影響(原材料)
- 主要原材料の価格変動
- サプライチェーン再構築
- 生産コストへの影響
- 供給側の影響(原材料)
- 需要側の影響(販売価格)
- 最終市場への価格伝達
- 市場シェアの動向
- 消費者の反応パターン
- 影響を受ける主要企業
- 戦略的業界対応
- サプライチェーンの再構成
- 価格設定と製品戦略
- 政策関与
- 展望と今後の検討事項
- 貿易への影響
- 貿易統計(HSコード)
- 主要輸出国、2021-2024
- 主要輸入国、2021-2024
注:上記の貿易統計は主要国についてのみ提供されます
- 規制情勢
- 北米
- 欧州
- アジア太平洋地域
- その他の地域
- 影響要因
- 促進要因
- 天然エッセンシャルオイルの需要増加
- 化粧品・パーソナルケア分野での用途拡大
- 食品・飲料業界の成長
- 業界の潜在的リスク&課題
- 合成代替品との激しい競合
- 原材料の入手が限られている
- 促進要因
- 抽出および処理技術
- 伝統的な方法
- 現代の抽出技術
- サプライチェーンの構造とダイナミクス
- 原材料調達
- 生産と加工
- 流通チャネル
- コスト構造分析
- 生産コスト
- 処理コスト
- 流通およびマーケティングコスト
- 消費者行動
- 消費者の人口統計と嗜好
- 購入決定要因
- 品質と純度に関する考慮事項
- 価格感度
- 環境影響評価
- 成長可能性分析
- ポーター分析
- PESTEL分析
第4章 競合情勢
- イントロダクション
- 企業の市場シェア分析
- 競合ポジショニングマトリックス
- 戦略的展望マトリックス
- 市場利害関係者への戦略的提言
- メーカーおよびサプライヤーへの推奨事項
- 販売業者および小売業者への推奨事項
- 最終用途産業向けの推奨事項
- 戦略的取り組みと最近の動向
- 合併と買収
- パートナーシップとコラボレーション
- 製品の発売とイノベーション
第5章 市場推計・予測:タイプ別、2021-2034
- 主要動向
- 従来型
- オーガニック
第6章 市場推計・予測:用途別、2021-2034
- 主要動向
- 食品と飲料
- パーソナルケア&化粧品
- 医薬品
- アロマセラピー
- 家庭用洗剤
第7章 市場推計・予測:流通チャネル別、2021-2034
- 主要動向
- オンライン小売
- スーパーマーケット/ハイパーマーケット
- 専門店
- 直接販売
- その他
第8章 市場推計・予測:地域別、2021-2034
- 主要動向
- 北米
- 米国
- カナダ
- 欧州
- ドイツ
- 英国
- フランス
- スペイン
- イタリア
- ロシア
- アジア太平洋地域
- 中国
- インド
- 日本
- オーストラリア
- 韓国
- ラテンアメリカ
- ブラジル
- メキシコ
- 中東・アフリカ
- サウジアラビア
- 南アフリカ
- アラブ首長国連邦
第9章 企業プロファイル
- AG Organica
- Aura Cacia
- doTERRA
- Edens Garden
- Mountain Rose Herbs
- NOW Foods
- Phoenix Aromas &Essential Oils、LLC
- Plant Therapy Essential Oils
- The Lebermuth Company
- Young Living Essential Oils
目次
The Global Lemongrass Oil Market was valued at USD 56.3 million in 2024 and is estimated to grow at a CAGR of 9.7% to reach USD 142.2 million by 2034, driven by the growing popularity of lemongrass oil in cosmetics and personal care products, where it is valued for its antibacterial, antifungal, and anti-inflammatory properties. With increasing consumer demand for organic and plant-based ingredients, lemongrass oil has become a sought-after component in skincare, body care, and hair care products. The rise of the clean beauty movement and the trend toward chemical-free alternatives have fueled this demand, encouraging large cosmetics companies to integrate lemongrass oil into their product lines.
The use of lemongrass oil in beauty products such as cleansers, toners, and moisturizers is expanding. Oil is known for its ability to control excess oil production, reduce acne, and rejuvenate the skin. Its antioxidant properties are also utilized in anti-aging products to protect the skin from free radicals. In hair care, lemongrass oil is popular in shampoos and conditioners for its ability to nourish the scalp, fight dandruff, and strengthen hair. Additionally, its refreshing citrus scent has made it a popular ingredient in body washes and deodorants. This increasing consumer preference for plant-based beauty products drives the market's growth.
| Market Scope | |
|---|---|
| Start Year | 2024 |
| Forecast Year | 2025-2034 |
| Start Value | $56.3 Million |
| Forecast Value | $142.2 Million |
| CAGR | 9.7% |
The market is divided into conventional and organic types, with the conventional segment holding 74.1% share in 2024. Conventional lemongrass oil is more widely available and is produced through traditional farming methods. It serves various industries, including cosmetics, food, pharmaceuticals, and aromatherapy. Countries like India, China, and Indonesia lead in production, and their robust supply chains ensure the availability of lemongrass oil globally. Its high citral content makes it a favored ingredient in fragrances, insect repellents, and food flavorings, contributing to its widespread use.
The food and beverage industry remains the largest consumer of lemongrass oil, capturing a share of 29.1%, followed closely by the rapidly expanding pharmaceutical sector. Lemongrass oil is prized for its antibacterial properties, which make it an ideal addition to various food products such as herbal teas, soups, sauces, and confectioneries. Beyond its citrusy flavor, the oil offers digestive and antioxidant benefits, contributing to its growing popularity in food and beverage formulations. As more consumers seek natural and health-promoting ingredients, lemongrass oil's versatility in both culinary and wellness applications continues to drive demand within the sector.
India Lemongrass Oil Market generated USD 4.9 million in 2024, with India being a key oil producer. The United States and various European countries are the largest importers of lemongrass oil, accounting for a significant share of global demand. These regions rely heavily on the tropical countries where lemongrass is grown for essential oil extraction. The global demand for lemongrass oil continues to grow as international markets recognize the benefits of this versatile oil in both culinary and wellness products. As the market expands, India and other producing countries are poised to meet the increasing global demand, further solidifying their positions in the global lemongrass oil supply chain.
Leading companies in the lemongrass oil industry include Young Living Essential Oils, Edens Garden, Mountain Rose Herbs, NOW Foods, and Aura Cacia. These companies are focusing on product innovation, expanding their global presence, and increasing consumer education about the benefits of lemongrass oil. They are also exploring sustainable farming practices, building strategic partnerships with suppliers, and enhancing their product offerings to meet growing consumer demand for organic and eco-friendly products.
Table of Contents
Chapter 1 Methodology & Scope
- 1.1 Market scope & definition
- 1.2 Base estimates & calculations
- 1.3 Forecast calculation
- 1.4 Data sources
- 1.4.1 Primary
- 1.4.2 Secondary
- 1.4.2.1 Paid sources
- 1.4.2.2 Public sources
- 1.5 Primary research and validation
- 1.5.1 Primary sources
- 1.5.2 Data mining sources
Chapter 2 Executive Summary
- 2.1 Industry synopsis, 2021-2034
Chapter 3 Industry Insights
- 3.1 Industry ecosystem analysis
- 3.1.1 Factor affecting the value chain
- 3.1.2 Profit margin analysis
- 3.1.3 Disruptions
- 3.1.4 Future outlook
- 3.1.5 Manufacturers
- 3.1.6 Distributors
- 3.2 Supplier landscape
- 3.3 Profit margin analysis
- 3.4 Trump Administration Tariffs
- 3.4.1 Impact on Trade
- 3.4.1.1 Trade Volume Disruptions
- 3.4.1.2 Retaliatory Measures
- 3.4.2 Impact on the Industry
- 3.4.2.1 Supply-Side Impact (Raw Materials)
- 3.4.2.1.1 Price Volatility in Key Materials
- 3.4.2.1.2 Supply Chain Restructuring
- 3.4.2.1.3 Production Cost Implications
- 3.4.2.1 Supply-Side Impact (Raw Materials)
- 3.4.3 Demand-Side Impact (Selling Price)
- 3.4.3.1 Price Transmission to End Markets
- 3.4.3.2 Market Share Dynamics
- 3.4.3.3 Consumer Response Patterns
- 3.4.4 Key Companies Impacted
- 3.4.5 Strategic Industry Responses
- 3.4.5.1 Supply Chain Reconfiguration
- 3.4.5.2 Pricing and Product Strategies
- 3.4.5.3 Policy Engagement
- 3.4.6 Outlook and Future Considerations
- 3.4.1 Impact on Trade
- 3.5 Trade statistics (HS Code)
- 3.5.1 Major Exporting Countries, 2021-2024 (Kilo Tons)
- 3.5.2 Major Importing Countries, 2021-2024 (Kilo Tons)
Note: the above trade statistics will be provided for key countries only.
- 3.6 Regulatory landscape
- 3.6.1 North America
- 3.6.2 Europe
- 3.6.3 Asia Pacific
- 3.6.4 Other Regions
- 3.7 Impact forces
- 3.7.1 Growth drivers
- 3.7.1.1 Growing demand for natural essential oils
- 3.7.1.2 Expanding applications in cosmetics & personal care
- 3.7.1.3 Growth in food & beverage industry
- 3.7.2 Industry pitfalls & challenges
- 3.7.2.1 Intense competition from synthetic alternatives
- 3.7.2.2 Limited availability of raw materials
- 3.7.1 Growth drivers
- 3.8 Extraction and Processing Technologies
- 3.8.1 Traditional Methods
- 3.8.2 Modern Extraction Technologies
- 3.9 Supply Chain Structure and Dynamics
- 3.9.1 Raw Material Sourcing
- 3.9.2 Production and Processing
- 3.9.3 Distribution Channels
- 3.10 Cost Structure Analysis
- 3.10.1 Production Costs
- 3.10.2 Processing Costs
- 3.10.3 Distribution and Marketing Costs
- 3.11 Consumer Behavior
- 3.11.1 Consumer Demographics and Preferences
- 3.11.2 Purchase Decision Factors
- 3.11.2.1 Quality and Purity Considerations
- 3.11.2.2 Price Sensitivity
- 3.12 Environmental Impact Assessment
- 3.13 Growth potential analysis
- 3.14 Porter's analysis
- 3.15 PESTEL analysis
Chapter 4 Competitive Landscape, 2024
- 4.1 Introduction
- 4.2 Company market share analysis
- 4.3 Competitive positioning matrix
- 4.4 Strategic outlook matrix
- 4.5 Strategic Recommendations for Market Stakeholders
- 4.5.1 Recommendations for Manufacturers and Suppliers
- 4.5.2 Recommendations for Distributors and Retailers
- 4.5.3 Recommendations for End Use Industries
- 4.6 Strategic Initiatives and Recent Developments
- 4.6.1 Mergers and Acquisitions
- 4.6.2 Partnerships and Collaborations
- 4.6.3 Product Launches and Innovations
Chapter 5 Market Estimates and Forecast, By Type, 2021 - 2034 (USD Million) (Kilo Tons)
- 5.1 Key trends
- 5.2 Conventional
- 5.3 Organic
Chapter 6 Market Estimates and Forecast, By Application, 2021 - 2034 (USD Million) (Kilo Tons)
- 6.1 Key trends
- 6.2 Food & beverages
- 6.3 Personal care & cosmetics
- 6.4 Pharmaceuticals
- 6.5 Aromatherapy
- 6.6 Household cleaning products
Chapter 7 Market Estimates and Forecast, By Distribution Channel, 2021 - 2034 (USD Million) (Kilo Tons)
- 7.1 Key trends
- 7.2 Online retail
- 7.3 Supermarkets/hypermarkets
- 7.4 Specialty stores
- 7.5 Direct sales
- 7.6 Others
Chapter 8 Market Estimates and Forecast, By Region, 2021 - 2034 (USD Million) (Kilo Tons)
- 8.1 Key trends
- 8.2 North America
- 8.2.1 U.S.
- 8.2.2 Canada
- 8.3 Europe
- 8.3.1 Germany
- 8.3.2 UK
- 8.3.3 France
- 8.3.4 Spain
- 8.3.5 Italy
- 8.3.6 Russia
- 8.4 Asia Pacific
- 8.4.1 China
- 8.4.2 India
- 8.4.3 Japan
- 8.4.4 Australia
- 8.4.5 South Korea
- 8.5 Latin America
- 8.5.1 Brazil
- 8.5.2 Mexico
- 8.6 Middle East and Africa
- 8.6.1 Saudi Arabia
- 8.6.2 South Africa
- 8.6.3 UAE
Chapter 9 Company Profiles
- 9.1 AG Organica
- 9.2 Aura Cacia
- 9.3 doTERRA
- 9.4 Edens Garden
- 9.5 Mountain Rose Herbs
- 9.6 NOW Foods
- 9.7 Phoenix Aromas & Essential Oils, LLC
- 9.8 Plant Therapy Essential Oils
- 9.9 The Lebermuth Company
- 9.10 Young Living Essential Oils
- 発行日
- 発行
- Global Market Insights Inc.
- ページ情報
- 英文 220 Pages
- 納期
- 2~3営業日