|
|
市場調査レポート
商品コード
1740968
揮発性有機化合物ガスセンサーの市場機会、成長促進要因、産業動向分析、2025年~2034年予測Volatile Organic Compound (VOC) Gas Sensor Market Opportunity, Growth Drivers, Industry Trend Analysis, and Forecast 2025 - 2034 |
||||||
|
|||||||
カスタマイズ可能
|
|||||||

| 揮発性有機化合物ガスセンサーの市場機会、成長促進要因、産業動向分析、2025年~2034年予測 |
|
出版日: 2025年04月16日
発行: Global Market Insights Inc.
ページ情報: 英文 162 Pages
納期: 2~3営業日
|

全表示
- 概要
- 目次
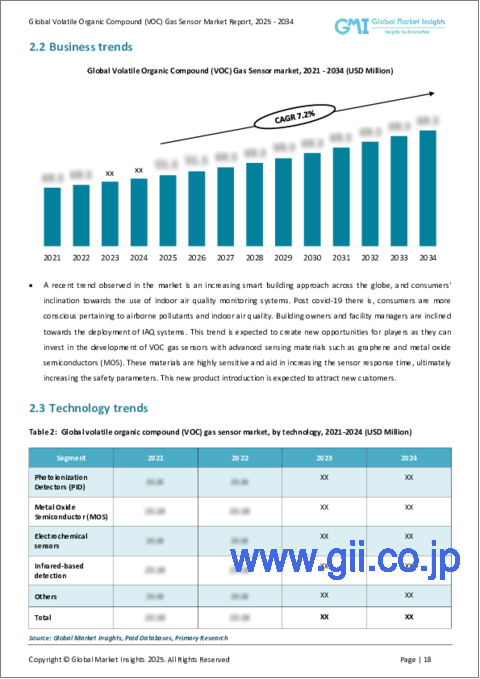
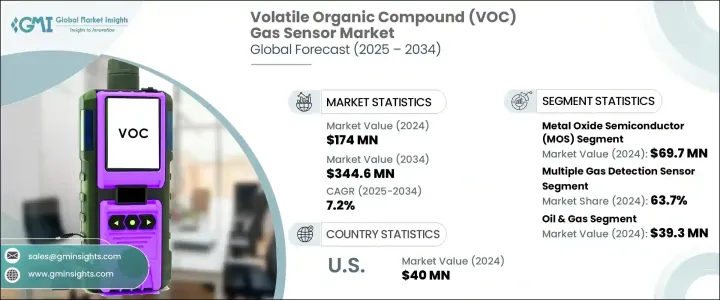
世界の揮発性有機化合物ガスセンサー市場は、2024年に1億7,400万米ドルと評価され、CAGR7.2%で成長し、2034年までには3億4,460万米ドルに達すると予測されています。
市場規模は予測期間末までに1億4,250万ユニットに達すると予測されます。この成長の主な要因は、石油・ガスなどの産業からの需要の増加、世界の大気質基準の強化、モノのインターネット(IoT)ネットワークやスマートデバイスへのガスセンサの統合が進んでいることです。大気汚染に対する懸念が高まり、正確なリアルタイム監視の必要性が高まる中、VOCガスセンサの用途は産業安全、ビルオートメーション、環境監視、自動車システムなどの分野で急速に拡大しています。これらのセンサーは、特にリスクの高い環境において、有害なガスを検知し、事前の安全対策を可能にするために不可欠です。技術の進歩により、ガスセンサーはより小型でコスト効率に優れ、応答性も高くなったため、民生用と産業用の両方のアプリケーションで採用が進んでいます。さらに、環境規制の強化や室内空気の質に対する意識の高まりが、先進国や新興経済諸国での市場開拓をさらに加速させています。
近年、特にグローバルサプライチェーンに影響を与えた貿易政策の変更により、市場は顕著な混乱に見舞われています。輸入電子製品に課された高関税は、センサー部品の海外調達に依存していた企業の生産コスト上昇につながりました。こうした措置により、多くのメーカーは調達戦略を見直し、代替供給ルートを模索するか、輸入依存度を軽減するために国内生産の拡大を検討せざるを得なくなりました。こうしたシフトは短期的には経営上の課題となりましたが、より現地に根ざした製造慣行へと徐々に変化するきっかけともなりました。この転換により、長期的にはより安定したサプライチェーンが構築され、地政学的リスクに対する脆弱性が軽減されることが期待されます。
| 市場範囲 | |
|---|---|
| 開始年 | 2024年 |
| 予測年 | 2025年~2034年 |
| 開始金額 | 1億7,400万米ドル |
| 予測金額 | 3億4,460万米ドル |
| CAGR | 7.2% |
技術別では、光イオン化検出器(PID)、金属酸化膜半導体(MOS)、電気化学センサ、赤外線ベースの検出、その他の新興技術に分類されます。金属酸化物半導体セグメントは2024年に市場をリードし、6,970万米ドルの収益を上げました。この成長の原動力となっているのは、MOSセンサの高速応答能力と、他の技術に比べて手頃な価格です。これらのセンサーは、金属酸化膜の抵抗変化を検出することで動作するため、継続的な空気品質モニタリングに最適です。スマートホーム、産業環境、自動車の安全アプリケーションに適しているため、商業用と民生用の両方の使用事例で人気のある選択肢となっています。MOSセンサーはまた、ホルムアルデヒド、ベンゼン、トルエンなど、屋内外の空気に一般的に含まれるさまざまなVOCを効率的に検出できることから、広く採用されています。
センサータイプによって、市場は単一ガス検知センサーと複数ガス検知センサーに分けられます。2024年には、複数ガス検知センサーが世界市場シェアの63.7%を占めました。これらのセンサーは、二酸化炭素(CO2)、一酸化炭素(CO)、二酸化窒素(NO2)、メタンなど、VOC以外のさまざまなガスを検出する能力で支持されています。その汎用性は、産業安全、包括的な環境モニタリング、スマートインフラシステムにとって不可欠です。産業界が多層的な検知能力を優先し続ける中、こうした多機能センサーの需要は、特にさまざまな危険ガスの存在が一般的な環境において、伸び続けています。
市場は最終用途産業別に、石油・ガス、農業、自動車、化学、製造、食品・飲料、金属・鉱業、その他に区分されます。石油・ガスセクターが2024年の市場規模を3,930万米ドルで支配しています。この業界におけるVOCガスセンサの需要が高いのは、ガス検知、排出ガス監視、職場の安全確保という重要なニーズによるところが大きいです。さらに、デジタル技術とIoTベースの監視システムの導入が増加しているため、予知保全と規制遵守のためにこれらのセンサーの導入が拡大しています。石油・ガス事業がより自動化され、環境に配慮したものに進化するにつれ、VOCセンサーの役割はさらに不可欠になっています。
2024年、米国のVOCガスセンサー市場は4,000万米ドルに達しました。環境保護庁(EPA)や労働安全衛生局(OSHA)などの規制機関は、産業・商業空間における空気品質監視のための厳格なガイドラインを施行し続けており、これが国内需要を押し上げています。さらに、近代的なビル、ヘルスケア施設、自動車における室内空気品質に対する意識の高まりが、HVACシステムやその他の室内環境へのVOCセンサーの統合を促しています。この動向は、電気自動車やコネクテッドインフラの台頭によってさらに後押しされ、空気浄化や車内空気モニタリングが標準化されつつあります。
世界のVOCガスセンサー市場は依然として非常に断片化されており、数多くの企業がさまざまなセグメントで多様なソリューションを提供しています。複数の多国籍企業を含む主要な市場参入企業は、合計で市場シェアの約28.5%を占めています。これらの企業は、検出感度の向上、小型化、デジタルプラットフォームとのシームレスな統合に焦点を当てた新製品や改良品を継続的に投入しており、これらすべてが市場のダイナミックで競争的な性質に寄与しています。
目次
第1章 調査手法と範囲
第2章 エグゼクティブサマリー
第3章 業界考察
- 業界エコシステム分析
- バリューチェーンに影響を与える要因
- 利益率分析
- ディスラプション
- 将来の展望
- 製造業者
- 販売代理店
- トランプ政権による関税への影響
- 貿易への影響
- 貿易量の混乱
- 報復措置
- 業界への影響
- 供給側の影響(原材料)
- 主要原材料の価格変動
- サプライチェーンの再構築
- 生産コストへの影響
- 需要側の影響(販売価格)
- 最終市場への価格伝達
- 市場シェアの動向
- 消費者の反応パターン
- 供給側の影響(原材料)
- 影響を受ける主要企業
- 戦略的な業界対応
- サプライチェーンの再構成
- 価格設定と製品戦略
- 政策関与
- 展望と今後の検討事項
- 貿易への影響
- サプライヤーの情勢
- 利益率分析
- 主なニュースと取り組み
- 規制情勢
- 影響要因
- 成長促進要因
- 石油・ガス部門全体の需要急増
- スマートシティへの政府と民間の投資の増加
- 厳しい大気質規制の施行
- IoT・スマートデバイスとの統合の拡大
- 空気中のVOC関連の健康リスクに関する意識の高まり
- 業界の潜在的リスク・課題
- 既存のインフラにおける統合の課題
- 高度なVOCセンサーの高コスト
- 成長促進要因
- 成長可能性分析
- ポーター分析
- PESTEL分析
第4章 競合情勢
- イントロダクション
- 企業の市場シェア分析
- 競合ポジショニングマトリックス
- 戦略的展望マトリックス
第5章 市場推計・予測:技術別、2021年~2034年
- 主要動向
- 光イオン化検出器(PID)
- 金属酸化物半導体(MOS)
- 電気化学センサー
- 赤外線ベースの検出
- その他
第6章 市場推計・予測:タイプ別、2021年~2034年
- 主要動向
- 単一ガス検知センサー
- 多ガス検知センサー
第7章 市場推計・予測:最終用途産業別、2021年~2034年
- 主要動向
- 石油・ガス
- 農業
- 自動車
- 化学産業
- 製造業
- 食品・飲料
- 金属・鉱業
- その他
第8章 市場推計・予測:地域別、2021年~2034年
- 主要動向
- 北米
- 米国
- カナダ
- 欧州
- 英国
- ドイツ
- フランス
- イタリア
- スペイン
- ロシア
- アジア太平洋
- 中国
- インド
- 日本
- 韓国
- オーストラリア
- ラテンアメリカ
- ブラジル
- メキシコ
- 中東・アフリカ
- 南アフリカ
- サウジアラビア
- アラブ首長国連邦
第9章 企業プロファイル
- ABB Ltd.
- Acal BFi Holdings Limited.
- Aeroqual Limited
- Alphasense Ltd.
- Amphenol Corporation
- ams AG
- Bosch Sensortec GmbH
- Danfoss
- EcoSensors
- Figaro Engineering Inc.
- GfG Europe Ltd.
- Honeywell International Inc.
- Ion Science Ltd.
- MEMBRAPOR AG
- MicroJet Technology Co.、Ltd.
- Renesas Electronics Corporation
- Sensirion AG
- SGX Sensortech Ltd
- Siemens AG
- Winsen
The Global Volatile Organic Compound Gas Sensor Market was valued at USD 174 million in 2024 and is estimated to grow at a CAGR of 7.2% to reach USD 344.6 million by 2034. The market volume is anticipated to hit 142.5 million units by the end of the forecast period. This growth is primarily driven by the increasing demand from industries such as oil and gas, the tightening of air quality standards worldwide, and the growing integration of gas sensors into Internet of Things (IoT) networks and smart devices. With rising concerns over air pollution and the need for accurate real-time monitoring, the application of VOC gas sensors is expanding rapidly across sectors including industrial safety, building automation, environmental monitoring, and automotive systems. These sensors are vital for detecting harmful gases and enabling proactive safety measures, particularly in high-risk environments. Technological advancements have made gas sensors more compact, cost-effective, and responsive, encouraging their adoption in both consumer and industrial applications. Furthermore, stricter environmental regulations and heightened awareness about indoor air quality are further accelerating market penetration across developed and developing economies.
The market has experienced notable disruptions in recent years, particularly due to trade policy changes that affected global supply chains. High tariffs imposed on imported electronic goods led to increased production costs for companies reliant on international sourcing for sensor components. These measures forced many manufacturers to reassess their procurement strategies and seek alternative supply routes or consider domestic production expansion to mitigate import dependency. Although these shifts posed short-term operational challenges, they also triggered a gradual transformation toward more localized manufacturing practices. This transition is expected to create more stable supply chains in the long term and reduce vulnerability to geopolitical risks.
| Market Scope | |
|---|---|
| Start Year | 2024 |
| Forecast Year | 2025-2034 |
| Start Value | $174 Million |
| Forecast Value | $344.6 Million |
| CAGR | 7.2% |
In terms of technology, the market is categorized into photoionization detectors (PID), metal oxide semiconductors (MOS), electrochemical sensors, infrared-based detection, and other emerging technologies. The metal oxide semiconductor segment led the market in 2024, generating USD 69.7 million in revenue. This growth is driven by MOS sensors' ability to deliver rapid response times and their affordability compared to other technologies. These sensors operate by detecting resistance changes in a metal oxide film, making them ideal for continuous air quality monitoring. Their suitability for smart homes, industrial environments, and automotive safety applications positions them as a popular choice across both commercial and consumer use cases. MOS sensors are also widely adopted for their efficiency in detecting various VOCs such as formaldehyde, benzene, and toluene, which are commonly found in both indoor and outdoor air.
Based on sensor type, the market is split into single gas detection sensors and multiple gas detection sensors. In 2024, multiple gas detection sensors accounted for 63.7% of the global market share. These sensors are favored for their ability to detect a variety of gases beyond VOCs, including carbon dioxide (CO2), carbon monoxide (CO), nitrogen dioxide (NO2), and methane. Their versatility is essential for industrial safety, comprehensive environmental monitoring, and smart infrastructure systems. As industries continue to prioritize multi-layered detection capabilities, the demand for these multifunctional sensors continues to grow, especially in environments where the presence of different hazardous gases is common.
By end-use industry, the market is segmented into oil and gas, agriculture, automotive, chemical, manufacturing, food and beverages, metals and mining, and others. The oil and gas sector dominated the market in 2024 with a value of USD 39.3 million. The high demand for VOC gas sensors in this industry is largely due to the critical need for gas detection, emissions monitoring, and workplace safety. Additionally, the increasing implementation of digital technologies and IoT-based monitoring systems has led to the broader deployment of these sensors for predictive maintenance and regulatory compliance. As oil and gas operations evolve to become more automated and environmentally responsible, the role of VOC sensors is becoming even more integral.
In 2024, the VOC gas sensor market in the United States reached USD 40 million. Regulatory bodies such as the Environmental Protection Agency (EPA) and the Occupational Safety and Health Administration (OSHA) continue to enforce stringent guidelines for air quality monitoring in industrial and commercial spaces, which is boosting domestic demand. Furthermore, rising awareness around indoor air quality in modern buildings, healthcare facilities, and vehicles is encouraging the integration of VOC sensors in HVAC systems and other indoor environments. This trend is further supported by the rise in electric vehicles and connected infrastructure, where air purification and in-cabin air monitoring are increasingly becoming standard.
The global VOC gas sensor market remains highly fragmented, with numerous players offering diverse solutions across different segments. Major industry participants, including several multinational corporations, collectively hold around 28.5% of the market share. These companies are continuously introducing new and improved products, focusing on enhanced detection sensitivity, miniaturization, and seamless integration with digital platforms, all of which are contributing to the dynamic and competitive nature of the market.
Table of Contents
Chapter 1 Methodology & Scope
- 1.1 Market scope & definitions
- 1.2 Base estimates & calculations
- 1.3 Forecast calculations
- 1.4 Data sources
- 1.4.1 Primary
- 1.4.2 Secondary
- 1.4.2.1 Paid sources
- 1.4.2.2 Public sources
Chapter 2 Executive Summary
- 2.1 Industry synopsis, 2021-2034
Chapter 3 Industry Insights
- 3.1 Industry ecosystem analysis
- 3.1.1 Factor affecting the value chain
- 3.1.2 Profit margin analysis
- 3.1.3 Disruptions
- 3.1.4 Future outlook
- 3.1.5 Manufacturers
- 3.1.6 Distributors
- 3.2 Trump administration tariffs
- 3.2.1 Impact on trade
- 3.2.1.1 Trade volume disruptions
- 3.2.1.2 Retaliatory measures
- 3.2.1.3 Impact on the industry
- 3.2.1.3.1 Supply-side impact (raw materials)
- 3.2.1.3.1.1 Price volatility in key materials
- 3.2.1.3.1.2 Supply chain restructuring
- 3.2.1.3.1.3 Production cost implications
- 3.2.1.3.2 Demand-side impact (selling price)
- 3.2.1.3.2.1 Price transmission to end markets
- 3.2.1.3.2.2 Market share dynamics
- 3.2.1.3.2.3 Consumer response patterns
- 3.2.1.3.1 Supply-side impact (raw materials)
- 3.2.1.4 Key companies impacted
- 3.2.1.5 Strategic industry responses
- 3.2.1.5.1 Supply chain reconfiguration
- 3.2.1.5.2 Pricing and product strategies
- 3.2.1.5.3 Policy engagement
- 3.2.1.6 Outlook and future considerations
- 3.2.1 Impact on trade
- 3.3 Supplier landscape
- 3.4 Profit margin analysis
- 3.5 Key news & initiatives
- 3.6 Regulatory landscape
- 3.7 Impact forces
- 3.7.1 Growth drivers
- 3.7.1.1 Surge in demand across oil & gas sector
- 3.7.1.2 Rising government & private investments in smart cities
- 3.7.1.3 Imposition of stringent air quality regulations
- 3.7.1.4 Increasing integration with IoT & smart devices
- 3.7.1.5 Growing awareness about airborne VOC-related health risks
- 3.7.2 Industry pitfalls & challenges
- 3.7.2.1 Integration challenges in existing infrastructure
- 3.7.2.2 High cost of advanced VOC sensors
- 3.7.1 Growth drivers
- 3.8 Growth potential analysis
- 3.9 Porter's analysis
- 3.10 PESTEL analysis
Chapter 4 Competitive Landscape, 2024
- 4.1 Introduction
- 4.2 Company market share analysis
- 4.3 Competitive positioning matrix
- 4.4 Strategic outlook matrix
Chapter 5 Market Estimates & Forecast, By Technology, 2021-2034 (USD Million & Units)
- 5.1 Key trends
- 5.2 Photoionization Detectors (PID)
- 5.3 Metal Oxide Semiconductor (MOS)
- 5.4 Electrochemical sensors
- 5.5 Infrared-based detection
- 5.6 Others
Chapter 6 Market Estimates & Forecast, By Type, 2021-2034 (USD Million & Units)
- 6.1 Key trends
- 6.2 Single gas detection sensor
- 6.3 Multiple gas detection sensor
Chapter 7 Market Estimates & Forecast, By End Use Industry, 2021-2034 (USD Million & Units)
- 7.1 Key trends
- 7.2 Oil & gas
- 7.3 Agriculture
- 7.4 Automotive
- 7.5 Chemical industry
- 7.6 Manufacturing
- 7.7 Food & beverages
- 7.8 Metals & mining
- 7.9 Others
Chapter 8 Market Estimates & Forecast, By Region, 2021-2034 (USD Million & Units)
- 8.1 Key trends
- 8.2 North America
- 8.2.1 U.S.
- 8.2.2 Canada
- 8.3 Europe
- 8.3.1 UK
- 8.3.2 Germany
- 8.3.3 France
- 8.3.4 Italy
- 8.3.5 Spain
- 8.3.6 Russia
- 8.4 Asia Pacific
- 8.4.1 China
- 8.4.2 India
- 8.4.3 Japan
- 8.4.4 South Korea
- 8.4.5 Australia
- 8.5 Latin America
- 8.5.1 Brazil
- 8.5.2 Mexico
- 8.6 MEA
- 8.6.1 South Africa
- 8.6.2 Saudi Arabia
- 8.6.3 UAE
Chapter 9 Company Profiles
- 9.1 ABB Ltd.
- 9.2 Acal BFi Holdings Limited.
- 9.3 Aeroqual Limited
- 9.4 Alphasense Ltd.
- 9.5 Amphenol Corporation
- 9.6 ams AG
- 9.7 Bosch Sensortec GmbH
- 9.8 Danfoss
- 9.9 EcoSensors
- 9.10 Figaro Engineering Inc.
- 9.11 GfG Europe Ltd.
- 9.12 Honeywell International Inc.
- 9.13 Ion Science Ltd.
- 9.14 MEMBRAPOR AG
- 9.15 MicroJet Technology Co., Ltd.
- 9.16 Renesas Electronics Corporation
- 9.17 Sensirion AG
- 9.18 SGX Sensortech Ltd
- 9.19 Siemens AG
- 9.20 Winsen
