
|
市場調査レポート
商品コード
1740953
銅と真鍮のフラット製品市場の市場機会、成長促進要因、産業動向分析、2025年~2034年予測Copper And Brass Flat Products Market Opportunity, Growth Drivers, Industry Trend Analysis, and Forecast 2025 - 2034 |
||||||
カスタマイズ可能
|
|||||||
| 銅と真鍮のフラット製品市場の市場機会、成長促進要因、産業動向分析、2025年~2034年予測 |
|
出版日: 2025年04月28日
発行: Global Market Insights Inc.
ページ情報: 英文 300 Pages
納期: 2~3営業日
|

全表示
- 概要
- 目次
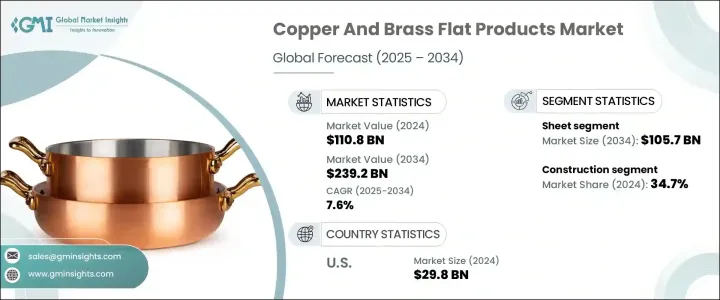
世界の銅と真鍮のフラット製品市場は、2024年に1,108億米ドルと評価され、2034年には2,392億米ドルに達するまでCAGR 7.6%で成長すると推定されています。
銅と真鍮は、その優れた導電性、耐食性、多くの用途への適応性から広く選ばれています。電気自動車や再生可能エネルギー・システムの人気の高まり、エレクトロニクス分野での技術進歩が、市場の着実な拡大に貢献しています。電気・電子部品はその優れた性能から、ますます銅に頼るようになっています。
さらに、多くの産業でエネルギー効率と先進的なエンジニアリングを推進する動きが、銅と真鍮のフラット製品の需要をさらに押し上げています。産業界がエネルギー節約を優先し続けるなか、これらの金属は最適な性能と長期的な耐久性を必要とする用途でますます利用されるようになっています。銅と真鍮は、熱伝導性と電気伝導性に優れていることで知られており、熱とエネルギーを効率的に管理する必要があるシステムや部品に最適です。例えば、産業機械では、熱交換器、ラジエーター、冷却システムに銅と真鍮のフラット製品が一般的に使用されており、熱を効率的に伝導する能力が、エネルギー使用の最適化と過熱防止に役立っています。
| 市場範囲 | |
|---|---|
| 開始年 | 2024 |
| 予測年 | 2025-2034 |
| 開始金額 | 1,108億米ドル |
| 予測金額 | 2,392億米ドル |
| CAGR | 7.6% |
銅と真鍮のフラット製品市場の製品タイプの中では、シート・セグメントが主要セグメントとして浮上しており、2024年の市場規模は497億米ドルです。このセグメントは大きく成長し、2034年には1,057億米ドルに達すると予想されています。銅と真鍮のシートは、その柔軟性、加工のしやすさ、多用途性で好まれ、多くの産業で高い人気を誇っています。これらの材料は、優れた強度、可鍛性、美的魅力で知られており、そのすべてが広く使用される要因となっています。さまざまなサイズや形に簡単に切断、成形、加工できるため、さまざまな用途に適応できるのです。
銅と真鍮のシートの需要は特に建築分野で高く、34.7%のシェアを占める最大の市場促進要因となっています。これらの素材は近代建築の構造的・装飾的要素に欠かせないものです。銅板や黄銅板は帯板や板材とともに、屋根材、壁材、雨どい、樋、窓枠、ドア枠などに広く使われています。耐食性に優れているため、耐久性と寿命が重要な外装用途に最適です。さらに、温かみのある光沢のある外観などの美的特質により、装飾的な特徴や装飾的なファサードなどの建築の細部によく使われます。世界的に都市化が加速し続けるなか、銅と真鍮のシートの需要は急速に伸びると予想されます。
米国銅と真鍮のフラット製品市場は2024年に298億米ドルを占め、2025年から2034年にかけてCAGR 7.4%で成長すると予測されています。この国の銅と真鍮のフラット製品に対する高い需要は、電気モビリティ、再生可能電力、最新の通信システムなどの先端技術の拡大と結びついています。銅は放熱や効率的な送電に役立っているため、新興のハイテク・インフラには欠かせません。その結果、米国は今後も主要な消費国であり続けると予想されています。
世界銅と真鍮のフラット製品市場の主要企業には、Global Copper Conductors、Gujarat Copper Alloys Ltd、Aurubis、Chhajed Steel Limited、KME Copperなどがあります。市場でのプレゼンスを拡大し、競争力を維持するために、主要企業はいくつかの効果的な戦略を実施しています。企業は精度、品質、生産量を向上させるため、高度な製造技術に投資しています。戦略的パートナーシップや買収は、地理的な範囲や製品ポートフォリオの拡大に役立っています。持続可能性は強力な焦点であり、企業は環境に優しい生産方法とリサイクル可能な材料を採用しています。
目次
第1章 調査手法と範囲
第2章 エグゼクティブサマリー
第3章 業界考察
- エコシステム分析
- バリューチェーンに影響を与える要因
- 利益率分析
- ディスラプション
- 将来の展望
- 製造業者
- 販売代理店
- トランプ政権による関税への影響
- 貿易への影響
- 貿易量の混乱
- 報復措置
- 業界への影響
- 供給側の影響(原材料)
- 主要原材料の価格変動
- サプライチェーンの再構築
- 生産コストへの影響
- 需要側の影響(販売価格)
- 最終市場への価格伝達
- 市場シェアの動向
- 消費者の反応パターン
- 供給側の影響(原材料)
- 影響を受ける主要企業
- 戦略的な業界対応
- サプライチェーンの再構成
- 価格設定と製品戦略
- 政策関与
- 展望と今後の検討事項
- 貿易への影響
- 貿易統計(HSコード)
- 主要輸出国、2021-2024
- 主要輸入国、2021-2024
注:上記の貿易統計は主要国のみに提供されます
- 貿易への影響
- 貿易量の混乱
- 報復措置
- 業界への影響
- 供給側の影響(原材料)
- 主要原材料の価格変動
- サプライチェーンの再構築
- 生産コストへの影響
- 需要側の影響(販売価格)
- 最終市場への価格伝達
- 市場シェアの動向
- 消費者の反応パターン
- 供給側の影響(原材料)
- 影響を受ける主要企業
- 戦略的な業界対応
- サプライチェーンの再構成
- 価格設定と製品戦略
- 政策関与
- 展望と今後の検討事項
- サプライヤーの情勢
- 利益率分析
- 主なニュースと取り組み
- 規制情勢
- 影響要因
- 促進要因
- 食品サービスとホスピタリティ業界からの需要増加
- バイオマス発電の成長
- Eコマースと消費者直販の拡大
- 業界の潜在的リスク&課題
- 森林破壊と規制
- 促進要因
- 成長可能性分析
- ポーター分析
- PESTEL分析
第4章 競合情勢
- イントロダクション
- 企業の市場シェア分析
- 競合ポジショニングマトリックス
- 戦略的展望マトリックス
第5章 市場規模・予測:木材の種類別、2021-2034
- 主要動向
- 丸太
- ウッドチップ
- ペレット
- 林業残渣
- その他
第6章 市場規模・予測:最終用途別、2021-2034
- 主要動向
- 食品サービス
- 電力配分
- その他
第7章 市場規模・予測:流通チャネル別、2021-2034
- 主要動向
- ハイパーマーケットとスーパーマーケット
- 専門店
- eコマース
- ビジネス間取引
- その他
第8章 市場規模・予測:地域別、2021-2034
- 主要動向
- 北米
- 米国
- カナダ
- 欧州
- 英国
- ドイツ
- フランス
- イタリア
- スペイン
- オランダ
- アジア太平洋地域
- 中国
- インド
- 日本
- 韓国
- オーストラリア
- ラテンアメリカ
- ブラジル
- メキシコ
- アルゼンチン
- 中東・アフリカ
- 南アフリカ
- サウジアラビア
- アラブ首長国連邦
第9章 企業プロファイル
- Cornish Firewood
- Firewood Fuel
- Lost Coast Forest Products
- JB Firewood
- Pinnacle Firewood Company
- Surefire Wood
- Wilson Enterprises
- Cutting Edge Firewood
- Wood Step
- The Log Store Group
- Woodmill
- Premier Firewood Company
- UAB Vli Timber
- Woodbioma
The Global Copper and Brass Flat Products Market was valued at USD 110.8 billion in 2024 and is estimated to grow at a CAGR of 7.6% to reach USD 239.2 billion by 2034, driven by the rising investments in infrastructure and industrial development worldwide drives the growing demand for these metal products. Copper and brass are widely chosen for their excellent conductivity, corrosion resistance, and adaptability in numerous applications. The rising popularity of electric vehicles, renewable energy systems, and ongoing technological progress across the electronics sector contribute to steady market expansion. Electrical and electronic components increasingly rely on copper due to their superior performance.
Moreover, the drive toward energy efficiency and advanced engineering across numerous industries is further boosting the demand for copper and brass flat products. As industries continue to prioritize energy savings, these metals are being increasingly utilized in applications that require optimal performance and long-term durability. Copper and brass are known for their excellent thermal and electrical conductivity, which makes them ideal for systems and components that need to efficiently manage heat and energy. For example, in industrial machinery, copper and brass flat products are commonly used in heat exchangers, radiators, and cooling systems, where their ability to conduct heat effectively helps optimize energy use and prevent overheating.
| Market Scope | |
|---|---|
| Start Year | 2024 |
| Forecast Year | 2025-2034 |
| Start Value | $110.8 Billion |
| Forecast Value | $239.2 Billion |
| CAGR | 7.6% |
Among the product types in the copper and brass flat products market, the sheets segment has emerged as the leading segment, with a market value of USD 49.7 billion in 2024. This segment is expected to grow significantly, reaching USD 105.7 billion by 2034. Copper and brass sheets are favored for their flexibility, ease of processing, and versatility, making them highly sought after across numerous industries. These materials are known for their superior strength, malleability, and aesthetic appeal, all contribute to their widespread use. Their ability to be easily cut, shaped, and fabricated into various sizes and forms enables them to be adapted to varied applications.
The demand for copper and brass sheets is particularly high in the construction sector, which is the largest market driver, accounting for 34.7% share. These materials are integral to both structural and decorative elements in modern buildings. Copper and brass sheets, along with strips and plates, are used extensively in the construction of roofing systems, wall cladding, gutters, downspouts, and window and door frames. Their corrosion resistance makes them ideal for exterior applications where durability and longevity are critical. Additionally, their aesthetic qualities, including their warm, lustrous appearance, make them a popular choice for architectural detailing, such as ornamental features and decorative facades. As urbanization continues to accelerate globally, the demand for copper and brass sheets is expected to grow rapidly.
United States Copper and Brass Flat Products Market accounted for USD 29.8 billion in 2024 and is projected to grow at a CAGR of 7.4% from 2025 to 2034. The nation's high demand for copper and brass flat products is tied to the expansion of advanced technologies, including electric mobility, renewable power, and modern communication systems. Copper's role in heat dissipation and efficient power transmission makes it indispensable for emerging tech infrastructure. As a result, the U.S. is expected to remain a leading consumer in the coming years.
Leading companies in the Global Copper and Brass Flat Products Market include Global Copper Conductors, Gujarat Copper Alloys Ltd, Aurubis, Chhajed Steel Limited, and KME Copper. To expand market presence and stay competitive, key players are implementing several effective strategies. Companies invest in advanced manufacturing technologies to improve precision, quality, and output. Strategic partnerships and acquisitions are helping expand their geographical reach and product portfolios. Sustainability is a strong focus, with firms adopting eco-friendly production methods and recyclable materials.
Table of Contents
Chapter 1 Methodology & Scope
- 1.1 Market scope & definition
- 1.2 Base estimates & calculations
- 1.3 Forecast calculation
- 1.4 Data sources
- 1.4.1 Primary
- 1.4.2 Secondary
- 1.4.2.1 Paid sources
- 1.4.2.2 Public sources
Chapter 2 Executive Summary
- 2.1 Industry synopsis, 2021 - 2034
Chapter 3 Industry Insights
- 3.1 Industry ecosystem analysis
- 3.1.1 Factor affecting the value chain
- 3.1.2 Profit margin analysis
- 3.1.3 Disruptions
- 3.1.4 Future outlook
- 3.1.5 Manufacturers
- 3.1.6 Distributors
- 3.2 Trump administration tariffs
- 3.2.1 Impact on trade
- 3.2.1.1 Trade volume disruptions
- 3.2.1.2 Retaliatory measures
- 3.2.2 Impact on the Industry
- 3.2.2.1 Supply-Side impact (Raw Materials)
- 3.2.2.1.1 Price volatility in key materials
- 3.2.2.1.2 Supply chain restructuring
- 3.2.2.1.3 Production cost implications
- 3.2.2.2 Demand-Side impact (Selling Price)
- 3.2.2.2.1 Price transmission to end markets
- 3.2.2.2.2 Market share dynamics
- 3.2.2.2.3 Consumer response patterns
- 3.2.2.1 Supply-Side impact (Raw Materials)
- 3.2.3 Key companies impacted
- 3.2.4 Strategic industry responses
- 3.2.4.1 Supply chain reconfiguration
- 3.2.4.2 Pricing and product strategies
- 3.2.4.3 Policy engagement
- 3.2.5 Outlook and future considerations
- 3.2.1 Impact on trade
- 3.3 Trade statistics (HS Code)
- 3.3.1 Major exporting countries, 2021-2024 (USD Mn)
- 3.3.2 Major importing countries, 2021-2024 (USD Mn)
Note: The above trade statistics will be provided for key countries only
- 3.4 Impact on trade
- 3.4.1 Trade volume disruptions
- 3.4.2 Retaliatory measures
- 3.5 Impact on the industry
- 3.5.1 Supply-side impact (raw materials)
- 3.5.1.1 Price volatility in key materials
- 3.5.1.2 Supply chain restructuring
- 3.5.1.3 Production cost implications
- 3.5.2 Demand-side impact (selling price)
- 3.5.2.1 Price transmission to end markets
- 3.5.2.2 Market share dynamics
- 3.5.2.3 Consumer response patterns
- 3.5.1 Supply-side impact (raw materials)
- 3.6 Key companies impacted
- 3.7 Strategic industry responses
- 3.7.1 Supply chain reconfiguration
- 3.7.2 Pricing and product strategies
- 3.7.3 Policy engagement
- 3.8 Outlook and future considerations
- 3.9 Supplier landscape
- 3.10 Profit margin analysis
- 3.11 Key news & initiatives
- 3.12 Regulatory landscape
- 3.13 Impact forces
- 3.13.1 Growth drivers
- 3.13.1.1 Rising demand from food services & hospitality
- 3.13.1.2 Growth in biomass power generation
- 3.13.1.3 E-commerce & direct-to-consumer sales expansion
- 3.13.2 Industry pitfalls & challenges
- 3.13.2.1 Deforestation & regulatory restrictions
- 3.13.1 Growth drivers
- 3.14 Growth potential analysis
- 3.15 Porter's analysis
- 3.16 PESTEL analysis
Chapter 4 Competitive Landscape, 2024
- 4.1 Introduction
- 4.2 Company market share analysis
- 4.3 Competitive positioning matrix
- 4.4 Strategic outlook matrix
Chapter 5 Market Size and Forecast, By Wood Type, 2021 - 2034 (USD Million) (Tons)
- 5.1 Key trends
- 5.2 Log wood
- 5.3 Wood chips
- 5.4 Pellets
- 5.5 Forestry residues
- 5.6 Others
Chapter 6 Market Size and Forecast, By End Use, 2021 - 2034 (USD Million) (Tons)
- 6.1 Key trends
- 6.2 Food services
- 6.3 Power distribution
- 6.4 Others
Chapter 7 Market Size and Forecast, By Distribution Channel, 2021 - 2034 (USD Million) (Tons)
- 7.1 Key trends
- 7.2 Hypermarkets and supermarkets
- 7.3 Specialty stores
- 7.4 E-commerce
- 7.5 Business to business
- 7.6 Others
Chapter 8 Market Size and Forecast, By Region, 2021 - 2034 (USD Million) (Tons)
- 8.1 Key trends
- 8.2 North America
- 8.2.1 U.S.
- 8.2.2 Canada
- 8.3 Europe
- 8.3.1 UK
- 8.3.2 Germany
- 8.3.3 France
- 8.3.4 Italy
- 8.3.5 Spain
- 8.3.6 Netherlands
- 8.4 Asia Pacific
- 8.4.1 China
- 8.4.2 India
- 8.4.3 Japan
- 8.4.4 South Korea
- 8.4.5 Australia
- 8.5 Latin America
- 8.5.1 Brazil
- 8.5.2 Mexico
- 8.5.3 Argentina
- 8.6 MEA
- 8.6.1 South Africa
- 8.6.2 Saudi Arabia
- 8.6.3 UAE
Chapter 9 Company Profiles
- 9.1 Cornish Firewood
- 9.2 Firewood Fuel
- 9.3 Lost Coast Forest Products
- 9.4 JB Firewood
- 9.5 Pinnacle Firewood Company
- 9.6 Surefire Wood
- 9.7 Wilson Enterprises
- 9.8 Cutting Edge Firewood
- 9.9 Wood Step
- 9.10 The Log Store Group
- 9.11 Woodmill
- 9.12 Premier Firewood Company
- 9.13 UAB Vli Timber
- 9.14 Woodbioma

