
|
市場調査レポート
商品コード
1740930
海水淡水化・浄化装置市場の市場機会、成長促進要因、産業動向分析、2025~2034年予測Water Desalination and Purification Equipment Market Opportunity, Growth Drivers, Industry Trend Analysis, and Forecast 2025 - 2034 |
||||||
カスタマイズ可能
|
|||||||
| 海水淡水化・浄化装置市場の市場機会、成長促進要因、産業動向分析、2025~2034年予測 |
|
出版日: 2025年04月25日
発行: Global Market Insights Inc.
ページ情報: 英文 190 Pages
納期: 2~3営業日
|

全表示
- 概要
- 目次
世界の海水淡水化・浄化装置市場は、2024年に359億米ドルと評価され、CAGR 8.3%で成長し、2034年には778億米ドルに達すると推定されています。
この成長は、特に乾燥・半乾燥地域における人口密度の増加や急速な都市拡大により、淡水供給への圧力が高まっていることが主な原因です。河川や地下帯水層といった従来の水源が枯渇や汚染に直面し、気候変動による不安定さが増す中、淡水生産のための代替技術が人気を集めています。なかでも海水淡水化は、塩水や汽水をきれいな飲料水に変えることができるため、信頼できる選択肢として際立っています。逆浸透や電気透析のようなプロセスの技術的改良により、運転コストとエネルギー消費量が大幅に削減され、大規模展開に魅力的なものとなっています。農業、産業活動、都市開発において水は重要な資源であるため、一貫性のある持続可能な水ソリューションへの需要が、さまざまな分野で高度な海水淡水化・浄化システムの採用を促進しています。
この市場で最も急成長しているセグメントの1つが紫外線(UV)浄化です。2024年、UV浄化セグメントは88億米ドルの収益を上げ、2034年には205億米ドルに達すると予測されています。UVシステムは、有毒な化学製品別を生成することなく水中の有害微生物を除去する能力により、産業界全体で勢いを増しています。環境の持続可能性が世界の政策や産業運営の中心になるにつれて、UV浄化はその低エネルギー要件、最小限のメンテナンスの必要性、長期的な費用対効果のおかげで好ましい選択肢になりつつあります。また、これらの治療システムは適応性が高く、新しく開発された水処理フレームワークにも既存の水処理フレームワークにも容易に統合できるため、都市部と農村部の両方で使用できる魅力が高まっています。UVランプ技術の進歩により、システムの耐久性と性能が向上し、世界中で採用が進んでいます。安全な飲料水へのアクセスが世界の喫緊の課題となっている中、UV浄化は公共用水と民間用水を確保する上で重要な要素であると認識されつつあります。
| 市場範囲 | |
|---|---|
| 開始年 | 2024 |
| 予測年 | 2025-2034 |
| 開始金額 | 359億米ドル |
| 予測金額 | 778億米ドル |
| CAGR | 8.3% |
流通チャネルは、この機器がどのようにエンドユーザーに届くかに重要な役割を果たしています。2024年には、間接流通チャネルが市場全体の50.12%を占め、市場を独占しており、2034年には376億米ドルの評価額に達すると予測されています。このルートは、各市場に物理的な拠点を設けることなく、地理的な足跡を拡大しようとするメーカーにとって有利であることが証明されています。再販業者、代理店、第三者販売業者との提携を通じて、企業は現地の市場知識、規制への精通度、既存の顧客ネットワークを活用することができます。このアプローチにより、新市場への製品導入に必要な時間が大幅に短縮されるとともに、ロジスティクスとオペレーションの効率が最適化されます。そのため、間接販売は、多様な地域へのリーチと対応力の両方を強化する戦略的手段となっています。
運営形態に関しては、自動システムが市場をリードしています。2024年には、自動システムが市場シェア全体の54.8%を占めると予想されます。これらのシステムは、薬液注入、圧力レベル、流量などの重要な運転パラメーターをリアルタイムで監視し、自動制御することができます。自動システムの初期コストは一般的に手動システムよりも高いが、労働依存度の低下、メンテナンスの軽減、エネルギー効率の向上など、長期的なメリットにより、大規模施設や遠隔地の施設ではより現実的なものとなります。さらに、IoTや遠隔監視技術との統合は、運転の信頼性を高め、大規模海水淡水化プラントにとって重要な分散型インフラの集中管理を可能にします。
地域別では、米国が2024年の北米市場で84.30%の圧倒的なシェアを占めており、予測期間中もCAGR 8.9%で拡大が続くと予想されます。同国の優位性は、特に干ばつや水不足の影響を受ける地域で、高度な水処理ソリューションに対する需要が高いことによる。国内外の主要企業は、持続可能な水利用をサポートする革新的なシステムの提供に積極的に取り組んでいます。これらの企業は、研究開発に多額の投資を行い、設計からメンテナンスまで包括的なサービスを提供しており、大規模な産業・自治体プロジェクトの信頼できるパートナーとしての地位を確立しています。
市場の主要企業である北米ベオリア、アクアテック・インターナショナル、スエズ・ウォーター・テクノロジーズ&ソリューションズ、ザイレム、IDEテクノロジーズの5社は、合計で世界売上高の約40%から50%を占めています。これらの企業は、逆浸透膜、UVシステム、膜ろ過などのフルサービス・ソリューションと最先端技術を世界中の顧客に提供しています。エネルギー効率、環境に優しい慣行、公共・民間部門との戦略的協力関係を重視することで、海水淡水化・純水化の進化におけるリーダーシップはさらに強化されています。
目次
第1章 調査手法と範囲
第2章 エグゼクティブサマリー
第3章 業界考察
- エコシステム分析
- バリューチェーンに影響を与える要因
- 利益率分析
- ディスラプション
- 将来の展望
- 製造業者
- 販売代理店
- トランプ政権の関税分析
- 貿易への影響
- 貿易量の混乱
- 報復措置
- 業界への影響
- 供給側の影響(原材料)
- 主要原材料の価格変動
- サプライチェーンの再構築
- 生産コストへの影響
- 需要側の影響(販売価格)
- 最終市場への価格伝達
- 市場シェアの動向
- 消費者の反応パターン
- 影響を受ける主要企業
- 戦略的な業界対応
- サプライチェーンの再構成
- 価格設定と製品戦略
- 政策関与
- 展望と今後の検討事項
- 貿易への影響
- 影響要因
- 促進要因
- 水不足と淡水需要の増加
- 政府の取り組みと規制
- 技術的進歩
- 業界の潜在的リスク&課題
- 高い資本コストと運用コスト
- 発展途上地域におけるインフラと投資の不足
- 促進要因
- 成長可能性分析
- ポーター分析
- PESTEL分析
第4章 競合情勢
- イントロダクション
- 企業の市場シェア分析
- 競合ポジショニングマトリックス
- 戦略的展望マトリックス
第5章 市場推計・予測:技術別、2021-2034
- 主要動向
- ナノ濾過
- 逆浸透(RO)
- 多段フラッシュ(MSF)蒸留
- 多重効果蒸留(MED)
- 紫外線(UV)浄化
- 活性炭ろ過
- その他(限外濾過、イオン交換など)
第6章 市場推計・予測:動作モード別、2021-2034
- 主要動向
- 自動システム
- 手動システム
第7章 市場推計・予測:システム規模別、2021-2034
- 主要動向
- 小規模システム
- 中規模システム
- 大規模システム
第8章 市場推計・予測:用途別、2021-2034
- 主要動向
- 淡水化
- 水の浄化
- 工業用水処理
- 家庭用水処理
- 農業用水処理
- ヘルスケア用水処理
- その他
第9章 市場推計・予測:最終用途別2021-2034
- 主要動向
- 市営
- 産業
- 住宅用
- 商業用
- その他(ヘルスケア、農業)
第10章 市場推計・予測:流通チャネル別2021-2034
- 主要動向
- 直接
- 間接的
第11章 市場推計・予測:地域別、2021-2034
- 主要動向
- 北米
- 米国
- カナダ
- 欧州
- 英国
- ドイツ
- フランス
- イタリア
- スペイン
- アジア太平洋地域
- 中国
- インド
- 日本
- オーストラリア
- 韓国
- ラテンアメリカ
- ブラジル
- メキシコ
- 中東・アフリカ
- アラブ首長国連邦
- 南アフリカ
- サウジアラビア
第12章 企業プロファイル
- Aquatech International
- Doosan Heavy Industries and Construction
- Dupont
- GE Water and Process Technologies
- Hyflux
- IDE Technologies
- Lenntech
- Membranium
- Pentair
- Saudi Arabian Amiantit
- Suez Water Technologies and Solutions
- Tata Projects
- Toray Industries
- Veolia North America
- Xylem
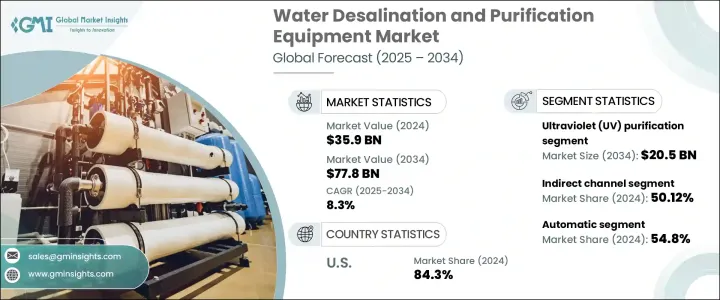
The Global Water Desalination and Purification Equipment Market was valued at USD 35.9 billion in 2024 and is estimated to grow at a CAGR of 8.3% to reach USD 77.8 billion by 2034. This growth is largely attributed to the rising pressure on freshwater supplies due to increasing population density and rapid urban expansion, especially in dry and semi-arid regions. As conventional water sources-such as rivers and underground aquifers-face depletion, pollution, and growing instability due to climate variability, alternative technologies for freshwater production are gaining traction. Among them, desalination stands out as a reliable option, particularly because it enables the transformation of saline and brackish water into clean drinking water. Technological improvements in processes like reverse osmosis and electrodialysis have significantly reduced operational costs and energy consumption, making them more attractive for large-scale deployment. With water being a critical resource across agriculture, industrial activities, and urban development, the demand for consistent and sustainable water solutions is driving the adoption of advanced desalination and purification systems across various sectors.
One of the fastest-growing segments in this market is ultraviolet (UV) purification. In 2024, the UV purification segment generated revenue of USD 8.8 billion and is anticipated to reach USD 20.5 billion by 2034. UV systems are gaining momentum across industries due to their ability to eliminate harmful microorganisms in water without producing toxic chemical by-products. As environmental sustainability becomes more central to global policy and industrial operations, UV purification is becoming a preferred choice thanks to its low energy requirements, minimal maintenance needs, and long-term cost-effectiveness. These systems are also adaptable and easy to integrate into both newly developed and pre-existing water treatment frameworks, increasing their appeal for use in both urban and rural applications. Advancements in UV lamp technology are enhancing system durability and performance, prompting greater adoption worldwide. As access to safe drinking water remains a pressing global concern, UV purification is being recognized as a critical component in securing water for both public and private use.
| Market Scope | |
|---|---|
| Start Year | 2024 |
| Forecast Year | 2025-2034 |
| Start Value | $35.9 Billion |
| Forecast Value | $77.8 Billion |
| CAGR | 8.3% |
Distribution channels play a significant role in how this equipment reaches end users. In 2024, the indirect distribution channel dominated the market, accounting for 50.12% of the overall share, and is projected to reach a valuation of USD 37.6 billion by 2034. This route has proven advantageous for manufacturers seeking to expand their geographical footprint without establishing a physical presence in every market. Through partnerships with resellers, agents, and third-party distributors, companies can leverage local market knowledge, regulatory familiarity, and pre-existing customer networks. This approach significantly reduces the time needed to introduce products to new markets while optimizing logistical and operational efficiency. Indirect distribution has therefore become a strategic tool in enhancing both reach and responsiveness across diverse regions.
When it comes to the mode of operation, automatic systems are leading the market. In 2024, automatic systems are expected to hold 54.8% of the total market share. These systems allow for real-time monitoring and automated control of critical operational parameters such as chemical dosing, pressure levels, and flow rates. Although the upfront cost of automatic systems is typically higher than their manual counterparts, the long-term benefits-including lower labor dependence, reduced maintenance, and enhanced energy efficiency-make them more viable for larger or remote facilities. Furthermore, integration with IoT and remote monitoring technologies enhances operational reliability and allows centralized management of distributed infrastructure, which is crucial for large-scale desalination plants.
Regionally, the United States held a commanding 84.30% share of the North American market in 2024 and is expected to continue expanding at a CAGR of 8.9% during the forecast years. The country's dominance is driven by high demand for advanced water treatment solutions, particularly in regions affected by drought and water scarcity. Leading domestic and international companies are actively involved in delivering innovative systems that support sustainable water use. These companies are heavily invested in R&D, offering comprehensive services from design to maintenance, and have established themselves as reliable partners for large-scale industrial and municipal projects.
The top five market players-Veolia North America, Aquatech International, SUEZ Water Technologies & Solutions, Xylem Inc., and IDE Technologies-collectively control about 40% to 50% of global revenue. These firms offer full-service solutions and cutting-edge technologies like reverse osmosis, UV systems, and membrane filtration to a global customer base. Their strong emphasis on energy efficiency, eco-friendly practices, and strategic collaborations with public and private sector entities further reinforce their leadership in the evolving landscape of water desalination and purification.
Table of Contents
Chapter 1 Methodology & Scope
- 1.1 Research design
- 1.1.1 Research approach
- 1.1.2 Data collection methods
- 1.2 Base estimates and calculations
- 1.2.1 Base year calculation
- 1.2.2 Key trends for market estimates
- 1.3 Forecast model
- 1.4 Primary research & validation
- 1.4.1 Primary sources
- 1.4.2 Data mining sources
- 1.5 Market definitions
Chapter 2 Executive Summary
- 2.1 Industry synopsis, 2021 - 2034
Chapter 3 Industry Insights
- 3.1 Industry ecosystem analysis
- 3.1.1 Factors affecting the value chain
- 3.1.2 Profit margin analysis
- 3.1.3 Disruptions
- 3.1.4 Future outlook
- 3.1.5 Manufacturers
- 3.1.6 Distributors
- 3.2 Trump administration tariffs analysis
- 3.2.1 Impact on trade
- 3.2.1.1 Trade volume disruptions
- 3.2.1.2 Retaliatory measures
- 3.2.2 Impact on the industry
- 3.2.2.1 Supply-Side Impact (Raw Materials)
- 3.2.2.2 Price volatility in key materials
- 3.2.2.3 Supply chain restructuring
- 3.2.2.4 Production cost implications
- 3.2.2.5 Demand-Side Impact (Selling Price)
- 3.2.2.6 Price transmission to end markets
- 3.2.2.7 Market share dynamics
- 3.2.2.8 Consumer response patterns
- 3.2.3 Key companies impacted
- 3.2.4 Strategic industry responses
- 3.2.4.1 Supply chain reconfiguration
- 3.2.4.2 Pricing and product strategies
- 3.2.4.3 Policy engagement
- 3.2.5 Outlook and Future considerations
- 3.2.1 Impact on trade
- 3.3 Impact forces
- 3.3.1 Growth drivers
- 3.3.1.1 Water scarcity and increasing demand for freshwater
- 3.3.1.2 Government initiatives and regulations
- 3.3.1.3 Technological advancements
- 3.3.2 Industry pitfalls & challenges
- 3.3.2.1 High capital and operating costs
- 3.3.2.2 Lack of infrastructure and investment in developing regions
- 3.3.1 Growth drivers
- 3.4 Growth potential analysis
- 3.5 Porter's analysis
- 3.6 PESTEL analysis
Chapter 4 Competitive Landscape, 2024
- 4.1 Introduction
- 4.2 Company market share analysis
- 4.3 Competitive positioning matrix
- 4.4 Strategic outlook matrix
Chapter 5 Market Estimates & Forecast, By Technology, 2021-2034 (USD Billion) (Thousand Units)
- 5.1 Key trends
- 5.2 Nanofiltration
- 5.3 Reverse osmosis (RO)
- 5.4 Multi-stage flash (MSF) distillation
- 5.5 Multi-effect distillation (MED)
- 5.6 Ultraviolet (UV) purification
- 5.7 Activated carbon filtration
- 5.8 Others (ultrafiltration, ion exchange, etc.)
Chapter 6 Market Estimates & Forecast, By Mode of Operation, 2021-2034 (USD Billion) (Thousand Units)
- 6.1 Key trends
- 6.2 Automatic systems
- 6.3 Manual systems
Chapter 7 Market Estimates & Forecast, By System Scale, 2021-2034 (USD Billion) (Thousand Units)
- 7.1 Key trends
- 7.2 Small-scale system
- 7.3 Medium-scale system
- 7.4 Large-scale systems
Chapter 8 Market Estimates & Forecast, By Application, 2021-2034 (USD Billion) (Thousand Units)
- 8.1 Key trends
- 8.2 Desalination
- 8.3 Water purification
- 8.4 Industrial water treatment
- 8.5 Household water treatment
- 8.6 Agricultural water treatment
- 8.7 Healthcare water treatment
- 8.8 Others
Chapter 9 Market Estimates & Forecast, By End Use 2021-2034 (USD Billion) (Thousand Units)
- 9.1 Key trends
- 9.2 Municipal
- 9.3 Industrial
- 9.4 Residential
- 9.5 Commercial
- 9.6 Others (healthcare, agriculture)
Chapter 10 Market Estimates & Forecast, By Distribution Channel 2021-2034 (USD Billion) (Thousand Units)
- 10.1 Key trends
- 10.2 Direct
- 10.3 Indirect
Chapter 11 Market Estimates & Forecast, By Region, 2021 - 2034 ($Bn) (Thousand Units)
- 11.1 Key trends
- 11.2 North America
- 11.2.1 U.S.
- 11.2.2 Canada
- 11.3 Europe
- 11.3.1 UK
- 11.3.2 Germany
- 11.3.3 France
- 11.3.4 Italy
- 11.3.5 Spain
- 11.4 Asia Pacific
- 11.4.1 China
- 11.4.2 India
- 11.4.3 Japan
- 11.4.4 Australia
- 11.4.5 South Korea
- 11.5 Latin America
- 11.5.1 Brazil
- 11.5.2 Mexico
- 11.6 MEA
- 11.6.1 UAE
- 11.6.2 South Africa
- 11.6.3 Saudi Arabia
Chapter 12 Company Profiles
- 12.1 Aquatech International
- 12.2 Doosan Heavy Industries and Construction
- 12.3 Dupont
- 12.4 GE Water and Process Technologies
- 12.5 Hyflux
- 12.6 IDE Technologies
- 12.7 Lenntech
- 12.8 Membranium
- 12.9 Pentair
- 12.10 Saudi Arabian Amiantit
- 12.11 Suez Water Technologies and Solutions
- 12.12 Tata Projects
- 12.13 Toray Industries
- 12.14 Veolia North America
- 12.15 Xylem
