
|
市場調査レポート
商品コード
1740893
構造用銅線の市場機会と促進要因、産業動向分析、2025年~2034年予測Structural Copper Wire Market Opportunity, Growth Drivers, Industry Trend Analysis, and Forecast 2025 - 2034 |
||||||
カスタマイズ可能
|
|||||||
| 構造用銅線の市場機会と促進要因、産業動向分析、2025年~2034年予測 |
|
出版日: 2025年04月28日
発行: Global Market Insights Inc.
ページ情報: 英文 300 Pages
納期: 2~3営業日
|

全表示
- 概要
- 目次
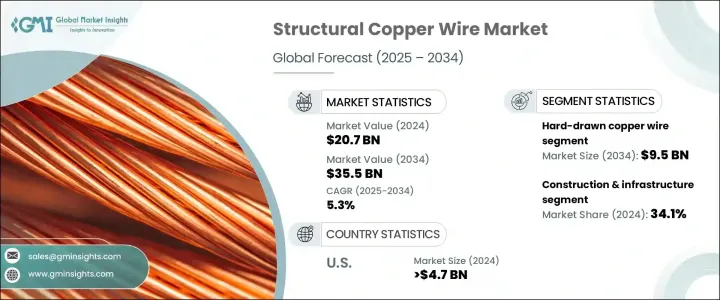
構造用銅線の世界市場規模は、2024年には207億米ドルに達し、CAGR 5.3%で成長し、2034年には355億米ドルに達すると予測されています。
標準的な銅線とは異なり、構造用銅線は物理的ストレス、気象条件、長期の暴露に耐えるように設計されており、需要の高い環境での使用に適しています。スマートインフラが拡大し、世界中で産業が急速に開発される中、このワイヤーは導電性と耐久性の両方を提供する重要な役割を担っています。大規模インフラ、エネルギーシステムの近代化、都市景観の電化に重点を置くセクターからの需要が急増しています。各国がインフラ・ネットワークのアップグレードに力を入れるなか、強力で信頼性の高い銅線ソリューションが不可欠になってきています。
さらに、持続可能なエネルギー・システムへのシフトは、特にソーラー・フィールドや風力発電所、エネルギー貯蔵システムなどの再生可能エネルギー・プロジェクトにおいて、構造用銅線に新たな道を開くことになります。銅の卓越した導電性と耐久性は、長期的な信頼性が不可欠なこうした用途の厳しい環境には理想的な素材です。ソーラー・エネルギー・システムでは、銅配線がソーラー・パネルと送電網をつなぎ、屋外の風雨に耐えながら、効率的な送電を実現します。
| 市場範囲 | |
|---|---|
| 開始年 | 2024 |
| 予測年 | 2025-2034 |
| 開始金額 | 207億米ドル |
| 予測金額 | 355億米ドル |
| CAGR | 5.3% |
さまざまな製品カテゴリーの中で、硬銅線は2024年に最も高い収益を上げ、56億米ドルに達し、2034年には95億米ドルに達すると予測されています。これらのワイヤーは機械的な強靭さで選ばれ、柔らかいものに比べて引っ張りにも強いです。その構造は、接地、配電、強度や耐久性が要求される配線など、物理的なひずみを伴う用途に最適です。硬引線は応力下でも完全性を維持し、建設とインフラに信頼できるソリューションを提供します。
建設・インフラ業界は34.1%のシェアを占め、市場をリードしています。銅の比類なき電気伝導性と、サイズに対する強度の効率のよさが、建築プロジェクトに選ばれる素材となっています。銅は性能を犠牲にすることなく、導体の直径を小さくすることができるため、設置やスペースの最適化に有利です。配線システムにおいては、他の素材に比べ、より多くの銅線をひとつのコンジットに収めることができ、建築設計の合理化に貢献します。
米国構造用銅線2024年の市場規模は47億米ドルで、2025年から2034年までCAGR 5.5%で成長すると予測されています。既存の電気ネットワークのアップグレードが進んでいることと、エネルギー効率規制の高まりが、銅の需要をさらに押し上げ、規制遵守と省エネルギーの両方のメリットをもたらしています。
世界の構造用銅線市場の主なプレーヤーは、General Cable Technologies Corporation、住友電気工業、Prysmian Group、Nexans、Alan Wire Companyなどです。この市場の主要企業は、先進的な戦略を採用しています。これには、製品の耐久性と一貫性を高めるための次世代製造技術への投資や、未開拓地域への進出のための戦略的提携などが含まれます。また厳しい環境下での性能を向上させるため、銅と高度な合金を組み合わせ、製品の配合を革新しています。持続可能性を重視し、多くのメーカーがリサイクル可能な素材やエネルギー効率の高いプロセスにシフトしています。
目次
第1章 調査手法と範囲
第2章 エグゼクティブサマリー
第3章 業界考察
- エコシステム分析
- バリューチェーンに影響を与える要因
- 利益率分析
- ディスラプション
- 将来の展望
- 製造業者
- 販売代理店
- トランプ政権による関税への影響
- 貿易への影響
- 貿易量の混乱
- 報復措置
- 業界への影響
- 供給側の影響(原材料)
- 主要原材料の価格変動
- サプライチェーンの再構築
- 生産コストへの影響
- 需要側の影響(販売価格)
- 最終市場への価格伝達
- 市場シェアの動向
- 消費者の反応パターン
- 供給側の影響(原材料)
- 影響を受ける主要企業
- 戦略的な業界対応
- サプライチェーンの再構成
- 価格設定と製品戦略
- 政策関与
- 展望と今後の検討事項
- 貿易への影響
- 貿易統計(HSコード)
- 主要輸出国、2021-2024
- 主要輸入国、2021-2024
注:上記の貿易統計は主要国のみに提供されます
- サプライヤーの情勢
- 利益率分析
- 主なニュースと取り組み
- 規制情勢
- 影響要因
- 促進要因
- インフラの近代化と拡張
- 再生可能エネルギープロジェクトの増加
- 航空宇宙および防衛投資の増加
- 業界の潜在的リスク&課題
- 高い材料費と生産コスト
- 促進要因
- 成長可能性分析
- ポーター分析
- PESTEL分析
第4章 競合情勢
- イントロダクション
- 企業の市場シェア分析
- 競合ポジショニングマトリックス
- 戦略的展望マトリックス
第5章 市場規模・予測:タイプ別、2021-2034
- 主要動向
- 硬銅線
- 銅被覆鋼線(CCS)
- 銅被覆アルミ線(CCA)
- ベリリウム銅線
- チタン被覆銅線
- その他
第6章 市場規模・予測:用途別、2021-2034
- 主要動向
- 建設・インフラ
- 送電・配電
- 鉄道・交通
- 航空宇宙および防衛
- 海洋およびオフショア設備
- その他
第7章 市場規模・予測:電圧別、2021-2034
- 主要動向
- 低電圧
- 中電圧
- 高電圧
第8章 市場規模・予測:地域別、2021-2034
- 主要動向
- 北米
- 米国
- カナダ
- 欧州
- 英国
- ドイツ
- フランス
- イタリア
- スペイン
- オランダ
- アジア太平洋地域
- 中国
- インド
- 日本
- 韓国
- オーストラリア
- ラテンアメリカ
- ブラジル
- メキシコ
- アルゼンチン
- 中東・アフリカ
- 南アフリカ
- サウジアラビア
- アラブ首長国連邦
第9章 企業プロファイル
- Prysmian Group
- Alan Wire Company
- Nexans
- General Cable Technologies Corporation
- Sumitomo Electric Industries
- Aviva Metals
- Luvata
- NINGBO JINTIAN COPPER(GROUP)
- SH Copper Products
- Tatung
The Global Structural Copper Wire Market was valued at USD 20.7 billion in 2024 and is estimated to grow at a CAGR of 5.3% to reach USD 35.5 billion by 2034, driven by increasing demand for mechanically robust, corrosion-resistant wiring solutions across various critical sectors. Unlike standard electrical copper wire, structural copper wire is engineered to withstand physical stress, weather conditions, and long-term exposure, making it suitable for use in high-demand environments. With the expansion of smart infrastructure and rapid industrial development worldwide, these wires play a vital role in delivering both conductivity and durability. Demand is surging from sectors focused on large-scale infrastructure, modernization of energy systems, and the push toward electrification in urban landscapes. As countries focus on upgrading their infrastructure networks, strong and reliable copper wire solutions are becoming essential.
Additionally, the shift toward sustainable energy systems opens new avenues for structural copper wiring, particularly in renewable energy projects such as solar fields, wind farms, and energy storage systems. Copper's exceptional conductivity and durability make it ideal material for the demanding environments found in these applications, where long-term reliability is essential. In solar energy systems, copper wiring connects solar panels to the grid, ensuring efficient power transmission while withstanding the outdoor elements.
| Market Scope | |
|---|---|
| Start Year | 2024 |
| Forecast Year | 2025-2034 |
| Start Value | $20.7 Billion |
| Forecast Value | $35.5 Billion |
| CAGR | 5.3% |
Among the different product categories, hard-drawn copper wire generated the highest revenue in 2024, reaching USD 5.6 billion, and is anticipated to hit USD 9.5 billion by 2034. These wires are chosen for their mechanical toughness and are more resistant to tension compared to softer alternatives. Their structure makes them ideal for applications involving physical strain, such as in grounding, power distribution, and wiring installations that demand strength and durability. Hard-drawn wires maintain their integrity under stress, providing a dependable solution for construction and infrastructure.
The construction and infrastructure industry led the market by accounting for 34.1% share. Copper's unmatched electrical conductivity and its strength-to-size efficiency make it the material of choice for building projects. Because copper allows for smaller-diameter conductors without sacrificing performance, it provides advantages in installation and space optimization. In wiring systems, more copper wires can fit into a single conduit compared to alternative materials, contributing to streamlined construction design.
United States Structural Copper Wire Market was valued at USD 4.7 billion in 2024 and is projected to grow at a CAGR of 5.5% from 2025 to 2034, driven by the growing adoption of copper wiring for high-performance electrical systems across commercial and institutional projects. Ongoing upgrades to existing electrical networks and rising energy efficiency regulations further drive the demand for copper, offering both regulatory compliance and energy-saving benefits.
Key players in the Global Structural Copper Wire Market include General Cable Technologies Corporation, Sumitomo Electric Industries, Prysmian Group, Nexans, and Alan Wire Company. Leading companies in this market are adopting forward-thinking strategies. These include investing in next-generation manufacturing technologies to enhance product durability and consistency, and forming strategic alliances to enter untapped regions. Firms are also innovating product formulations by combining copper with advanced alloys to improve performance in harsh environments. Emphasizing sustainability, many manufacturers are shifting to recyclable materials and energy-efficient processes to align with environmental regulations and meet customer expectations for greener solutions.
Table of Contents
Chapter 1 Methodology & Scope
- 1.1 Market scope & definition
- 1.2 Base estimates & calculations
- 1.3 Forecast calculation
- 1.4 Data sources
- 1.4.1 Primary
- 1.4.2 Secondary
- 1.4.2.1 Paid sources
- 1.4.2.2 Public sources
Chapter 2 Executive Summary
- 2.1 Industry synopsis, 2021 - 2034
Chapter 3 Industry Insights
- 3.1 Industry ecosystem analysis
- 3.1.1 Factor affecting the value chain
- 3.1.2 Profit margin analysis
- 3.1.3 Disruptions
- 3.1.4 Future outlook
- 3.1.5 Manufacturers
- 3.1.6 Distributors
- 3.2 Trump administration tariffs
- 3.2.1 Impact on trade
- 3.2.1.1 Trade volume disruptions
- 3.2.1.2 Retaliatory measures
- 3.2.2 Impact on the industry
- 3.2.2.1 Supply-side impact (raw materials)
- 3.2.2.1.1 Price volatility in key materials
- 3.2.2.1.2 Supply chain restructuring
- 3.2.2.1.3 Production cost implications
- 3.2.2.2 Demand-side impact (selling price)
- 3.2.2.2.1 Price transmission to end markets
- 3.2.2.2.2 Market share dynamics
- 3.2.2.2.3 Consumer response patterns
- 3.2.2.1 Supply-side impact (raw materials)
- 3.2.3 Key companies impacted
- 3.2.4 Strategic industry responses
- 3.2.4.1 Supply chain reconfiguration
- 3.2.4.2 Pricing and product strategies
- 3.2.4.3 Policy engagement
- 3.2.5 Outlook and future considerations
- 3.2.1 Impact on trade
- 3.3 Trade statistics (hs code)
- 3.3.1 Major exporting countries, 2021-2024 (usd mn)
- 3.3.2 Major importing countries, 2021-2024 (usd mn)
Note: The above trade statistics will be provided for key countries only
- 3.4 Supplier landscape
- 3.5 Profit margin analysis
- 3.6 Key news & initiatives
- 3.7 Regulatory landscape
- 3.8 Impact forces
- 3.8.1 Growth drivers
- 3.8.1.1 Infrastructure modernization & expansion
- 3.8.1.2 Rise in renewable energy projects
- 3.8.1.3 Growing aerospace & defense investments
- 3.8.2 Industry pitfalls & challenges
- 3.8.2.1 High material & production costs
- 3.8.1 Growth drivers
- 3.9 Growth potential analysis
- 3.10 Porter's analysis
- 3.11 PESTEL analysis
Chapter 4 Competitive Landscape, 2024
- 4.1 Introduction
- 4.2 Company market share analysis
- 4.3 Competitive positioning matrix
- 4.4 Strategic outlook matrix
Chapter 5 Market Size and Forecast, By Type, 2021 - 2034 (USD Million) (Tons)
- 5.1 Key trends
- 5.2 Hard-drawn copper wire
- 5.3 Copper-clad steel wire (CCS)
- 5.4 Copper-clad aluminum wire (CCA)
- 5.5 Beryllium copper wire
- 5.6 Titanium-clad copper wire
- 5.7 Others
Chapter 6 Market Size and Forecast, By Application, 2021 - 2034 (USD Million) (Tons)
- 6.1 Key trends
- 6.2 Construction & infrastructure
- 6.3 Power transmission & distribution
- 6.4 Railways & transportation
- 6.5 Aerospace & defense
- 6.6 Marine & offshore installations
- 6.7 Others
Chapter 7 Market Size and Forecast, By Voltage, 2021 - 2034 (USD Million) (Tons)
- 7.1 Key trends
- 7.2 Low voltage
- 7.3 Medium voltage
- 7.4 High voltage
Chapter 8 Market Size and Forecast, By Region, 2021 - 2034 (USD Million) (Tons)
- 8.1 Key trends
- 8.2 North America
- 8.2.1 U.S.
- 8.2.2 Canada
- 8.3 Europe
- 8.3.1 UK
- 8.3.2 Germany
- 8.3.3 France
- 8.3.4 Italy
- 8.3.5 Spain
- 8.3.6 Netherlands
- 8.4 Asia Pacific
- 8.4.1 China
- 8.4.2 India
- 8.4.3 Japan
- 8.4.4 South Korea
- 8.4.5 Australia
- 8.5 Latin America
- 8.5.1 Brazil
- 8.5.2 Mexico
- 8.5.3 Argentina
- 8.6 MEA
- 8.6.1 South Africa
- 8.6.2 Saudi Arabia
- 8.6.3 UAE
Chapter 9 Company Profiles
- 9.1 Prysmian Group
- 9.2 Alan Wire Company
- 9.3 Nexans
- 9.4 General Cable Technologies Corporation
- 9.5 Sumitomo Electric Industries
- 9.6 Aviva Metals
- 9.7 Luvata
- 9.8 NINGBO JINTIAN COPPER (GROUP)
- 9.9 SH Copper Products
- 9.10 Tatung
