
開閉器監視システムの市場機会、成長促進要因、産業動向分析、2025年~2034年予測
Switchgear Monitoring System Market Opportunity, Growth Drivers, Industry Trend Analysis, and Forecast 2025 - 2034- 発行日
- ページ情報
- 英文 121 Pages
- 納期
- 2~3営業日
- 商品コード
- 1740863
- カスタマイズ可能 お客様のご希望に応じて、既存データの加工や未掲載情報(例:国別セグメント)の追加などの対応が可能です。詳細はお問い合わせください。
- 翻訳ツール提供対象 PDF対応AI翻訳ツールの無料貸し出しサービスのご利用が可能です
概要
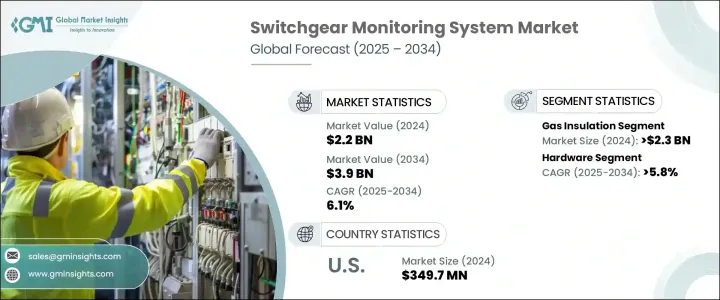
開閉器監視システムの世界市場規模は、2024年に22億米ドルとなり、CAGR 6.1%で成長し、2034年には39億米ドルに達すると予測されています。
スマート電力インフラの進化と相まって、送電網の安定性と回復力に対するニーズが高まっていることが、この需要急増の原動力となっています。世界中の配電網がより分散化・複雑化するにつれ、電力事業者やインフラ・プロバイダーは、ダウンタイムを最小限に抑え、運用効率を向上させるために、リアルタイムのモニタリングや予知保全ソリューションを求めています。これらのシステムは、故障や性能劣化の早期発見を可能にし、予期せぬ停電や費用のかかる修理の防止に役立ちます。
特にセンサー統合、データ分析、自動化の分野における技術の進歩が、インテリジェント・モニタリング・ソリューションの採用に拍車をかけています。現代の電力網は、変動するエネルギー負荷と多様な発電源(特に再生可能エネルギー)に対応するため、大きな変革期を迎えています。よりクリーンなエネルギー源へのシフトは、発電と配電に変動をもたらすため、システムの信頼性を維持し、化石燃料への依存度を低減するためには、高度なモニタリングが不可欠となっています。環境の持続可能性が重視される中、リアルタイム・モニタリング・システムは、エネルギー効率、二酸化炭素削減、長期的なインフラの信頼性を実現する鍵となりつつあります。
| 市場範囲 | |
|---|---|
| 開始年 | 2024 |
| 予測年 | 2025-2034 |
| 開始金額 | 22億米ドル |
| 予測金額 | 39億米ドル |
| CAGR | 6.1% |
2022年から2024年にかけて、開閉器監視システム業界は一貫した成長を遂げています。2022年の評価額は20億米ドル、2023年には21億米ドルに達し、2024年には22億米ドルに達します。この成長軌道は、産業製造、商業インフラ、公益事業ネットワークなどの部門における、中断のない安定した電力供給に対する需要の高まりに大きく影響されています。世界の電力需要の高まりに伴い、電気部品を保護し、エネルギーの流れを最適化するシステムの導入が急務となっています。スイッチギアは、電力管理と安全性において重要な要素であり、継続的な性能を確保し、運用上のリスクを低減し、機器の寿命を延ばす高度な監視システムを装備する傾向が強まっています。
市場の勢いに大きく寄与しているのは、特に新興国市場における電気インフラの老朽化です。多くの公益事業者は、システム全体を交換するのではなく、インテリジェント開閉器監視を含む改造ソリューションを選択しています。これらのソリューションは、大規模なオーバーホールを行わずに信頼性と安全性を高める費用対効果の高い方法を提供します。老朽化した送電網は、最新のエネルギー需要を満たすと同時に、最新の規制要件に準拠するために、スマート・コンポーネントでアップグレードされつつあります。予測分析、リアルタイムのデータ取得、早期の故障警告により、事業者は効率的にメンテナンスを計画し、致命的な故障を回避することができます。
この市場のハードウェアセグメントは、2034年までCAGR 5.8%以上で成長すると予測されています。リアルタイムの診断機能に対する需要が、センサー、リレー、サーキットブレーカー、通信モジュールなどのハードウェア・コンポーネントの開発と展開を加速しています。これらのコンポーネントは監視システムの中核を形成し、絶縁体の健全性、温度変動、電気的異常に関する重要な洞察を提供します。インフラ事業者がより高い透明性と制御性を求める中、ハードウェアの技術革新は、現代の複雑な配電に対応するため、より堅牢で応答性が高く、インテリジェントなシステムを可能にしています。
米国では、開閉器監視システム市場は一貫した成長を遂げており、2022年には3億2,210万米ドル、2023年には3億3,530万米ドル、2024年には3億4,970万米ドルに達します。エネルギー効率と運用信頼性を促進する連邦および州レベルの規制イニシアチブが、この増加において極めて重要な役割を果たしています。さらに、デジタル・グリッド技術と再生可能エネルギー源の統合への多額の投資が、電力会社や産業事業者に、資産全体の可視性と制御を強化する高度な監視ソリューションの採用を促しています。送電網がよりダイナミックになり、需要パターンが変化するにつれて、リアルタイムの監視と故障検出は、運用を成功させるために不可欠なツールになりつつあります。
市場の主要プレーヤーは、技術革新、戦略的な世界生産拠点、研究能力を通じて競合情勢を形成し続けています。これらの企業は、確立されたサプライチェーンと、品質と信頼性に対する高い評判から利益を得ています。世界な事業展開により、納期の合理化と生産コストの削減を実現し、地域市場の成長を支えながら、顧客により高い価値を提供しています。効率的で安全かつスケーラブルな電力システムに対する需要が高まる中、これらの企業は、先進国市場と新興国市場の両方における新たなビジネスチャンスを活用するのに有利な立場にあります。
目次
第1章 調査手法と範囲
第2章 エグゼクティブサマリー
第3章 業界考察
- エコシステム分析
- トランプ政権の関税分析
- 貿易への影響
- 貿易量の混乱
- 報復措置
- 業界への影響
- 供給側の影響(原材料)
- 主要原材料の価格変動
- サプライチェーンの再構築
- 生産コストへの影響
- 需要側の影響(販売価格)
- 最終市場への価格伝達
- 市場シェアの動向
- 消費者の反応パターン
- 供給側の影響(原材料)
- 影響を受ける主要企業
- 戦略的な業界対応
- サプライチェーンの再構成
- 価格設定と製品戦略
- 政策関与
- 展望と今後の検討事項
- 貿易への影響
- 規制情勢
- 業界への影響要因
- 促進要因
- 業界の潜在的リスク&課題
- 成長可能性分析
- ポーター分析
- PESTEL分析
第4章 競合情勢
- 戦略的ダッシュボード
- イノベーションと持続可能性の情勢
第5章 市場規模・予測:断熱材別、2021-2034
- 主要動向
- ガス断熱材
- 空気断熱
第6章 市場規模・予測:コンポーネント別、2021-2034
- 主要動向
- ハードウェア
- インテリジェント機器
- 配電網フィーダー
- その他
- ソフトウェア
第7章 市場規模・予測:サービス別、2021-2034
- 主要動向
- 部分放電監視
- ガス監視
- 温度監視
- その他のサービス
第8章 市場規模・予測:電圧別、2021-2034
- 主要動向
- 低
- 中
- ハイ&エクストラハイ
第9章 市場規模・予測:最終用途別、2021-2034
- 主要動向
- ユーティリティ
- 産業
- 商業用
第10章 市場規模・予測:地域別、2021-2034
- 主要動向
- 北米
- 米国
- カナダ
- メキシコ
- 欧州
- 英国
- フランス
- ドイツ
- イタリア
- ロシア
- スペイン
- アジア太平洋地域
- 中国
- オーストラリア
- インド
- 日本
- 韓国
- 中東・アフリカ
- サウジアラビア
- アラブ首長国連邦
- トルコ
- 南アフリカ
- エジプト
- ラテンアメリカ
- ブラジル
- アルゼンチン
第11章 企業プロファイル
- ABB
- Dynamic Ratings
- Eaton
- Emerson Electric
- General Electric
- Hitachi
- IPEC LTD.
- MEGGER
- Mitsubishi Electric
- OSENA Innovations
- Schneider Electric
- SENSEOR
- Siemens
目次
The Global Switchgear Monitoring System Market was valued at USD 2.2 billion in 2024 and is estimated to grow at a CAGR of 6.1% to reach USD 3.9 billion by 2034. The increasing need for grid stability and resilience, combined with the evolution of smart power infrastructure, is driving this surge in demand. As electricity distribution networks around the world become more decentralized and complex, utility operators and infrastructure providers are seeking real-time monitoring and predictive maintenance solutions to minimize downtime and improve operational efficiency. These systems enable early detection of faults and performance degradation, which in turn helps prevent unexpected power outages and costly repairs.
Technological progress, especially in the areas of sensor integration, data analytics, and automation, is fueling the adoption of intelligent monitoring solutions. Modern power grids are undergoing major transformations to accommodate fluctuating energy loads and diverse generation sources, particularly renewable energy. The shift towards cleaner energy sources introduces variability in power generation and distribution, making advanced monitoring essential for maintaining system reliability and reducing dependency on fossil fuels. With a growing emphasis on environmental sustainability, real-time monitoring systems are becoming key enablers of energy efficiency, carbon reduction, and long-term infrastructure reliability.
| Market Scope | |
|---|---|
| Start Year | 2024 |
| Forecast Year | 2025-2034 |
| Start Value | $2.2 Billion |
| Forecast Value | $3.9 Billion |
| CAGR | 6.1% |
Between 2022 and 2024, the switchgear monitoring system industry has experienced consistent growth. It was valued at USD 2 billion in 2022, reached USD 2.1 billion in 2023, and hit USD 2.2 billion by 2024. This growth trajectory is largely influenced by the rising demand for uninterrupted and stable electricity supply across sectors such as industrial manufacturing, commercial infrastructure, and utility networks. Power demand worldwide is climbing, and with it, the urgency to implement systems that safeguard electrical components and optimize energy flow. Switchgear, being a critical element in power management and safety, is increasingly being equipped with advanced monitoring systems that ensure continuous performance, reduce operational risks, and extend equipment lifespan.
A significant contributor to the market's momentum is the aging electrical infrastructure, particularly in developed regions. Rather than replacing entire systems, many utility providers are opting for retrofitting solutions that include intelligent switchgear monitoring. These solutions offer a cost-effective way to boost reliability and safety without major overhauls. Aging grids are being upgraded with smart components to meet modern energy demands while also staying compliant with updated regulatory requirements. Predictive analytics, real-time data acquisition, and early fault alerts allow operators to plan maintenance efficiently and avoid catastrophic failures.
The hardware segment within this market is growing at a projected CAGR of over 5.8% through 2034. Demand for real-time diagnostic capabilities is accelerating the development and deployment of hardware components like sensors, relays, circuit breakers, and communication modules. These components form the core of monitoring systems, delivering critical insights into insulation health, temperature fluctuations, and electrical anomalies. As infrastructure operators seek greater transparency and control, hardware innovations are enabling more robust, responsive, and intelligent systems to handle the complexities of modern power distribution.
In the United States, the switchgear monitoring system market has seen consistent growth, reaching USD 322.1 million in 2022, USD 335.3 million in 2023, and USD 349.7 million in 2024. Federal and state-level regulatory initiatives promoting energy efficiency and operational reliability are playing a pivotal role in this increase. Additionally, substantial investments in digital grid technology and the integration of renewable energy sources have prompted utility companies and industrial operators to adopt advanced monitoring solutions that enhance visibility and control across their assets. As grids become more dynamic and demand patterns shift, real-time surveillance and fault detection are becoming indispensable tools for operational success.
Key market players continue to shape the competitive landscape through innovation, strategic global manufacturing footprints, and research capabilities. These companies benefit from established supply chains and strong reputations for quality and reliability. Their global operations help streamline delivery times and reduce production costs, offering enhanced value to customers while supporting regional market growth. As the demand for efficient, secure, and scalable power systems rises, these players are well-positioned to capitalize on emerging opportunities in both developed and developing markets.
Table of Contents
Chapter 1 Methodology & Scope
- 1.1 Market definitions
- 1.2 Base estimates & calculations
- 1.3 Forecast calculation
- 1.4 Data sources
- 1.4.1 Primary
- 1.4.2 Secondary
- 1.4.2.1 Paid
- 1.4.2.2 Public
Chapter 2 Executive Summary
- 2.1 Industry synopsis, 2021 - 2034
Chapter 3 Industry Insights
- 3.1 Industry ecosystem analysis
- 3.2 Trump administration tariff analysis
- 3.2.1 Impact on trade
- 3.2.1.1 Trade volume disruptions
- 3.2.1.2 Retaliatory measures
- 3.2.2 Impact on the industry
- 3.2.2.1 Supply-side impact (raw materials)
- 3.2.2.1.1 Price volatility in key materials
- 3.2.2.1.2 Supply chain restructuring
- 3.2.2.1.3 Production cost implications
- 3.2.2.2 Demand-side impact (selling price)
- 3.2.2.2.1 Price transmission to end markets
- 3.2.2.2.2 Market share dynamics
- 3.2.2.2.3 Consumer response patterns
- 3.2.2.1 Supply-side impact (raw materials)
- 3.2.3 Key companies impacted
- 3.2.4 Strategic industry responses
- 3.2.4.1 Supply chain reconfiguration
- 3.2.4.2 Pricing and product strategies
- 3.2.4.3 Policy engagement
- 3.2.5 Outlook and future considerations
- 3.2.1 Impact on trade
- 3.3 Regulatory landscape
- 3.4 Industry impact forces
- 3.4.1 Growth drivers
- 3.4.2 Industry pitfalls & challenges
- 3.5 Growth potential analysis
- 3.6 Porter's analysis
- 3.6.1 Bargaining power of suppliers
- 3.6.2 Bargaining power of buyers
- 3.6.3 Threat of new entrants
- 3.6.4 Threat of substitutes
- 3.7 PESTEL analysis
Chapter 4 Competitive Landscape, 2024
- 4.1 Strategic dashboard
- 4.2 Innovation & sustainability landscape
Chapter 5 Market Size and Forecast, By Insulation, 2021 - 2034 (USD Million)
- 5.1 Key trends
- 5.2 Gas insulation
- 5.3 Air insulation
Chapter 6 Market Size and Forecast, By Component, 2021 - 2034 (USD Million)
- 6.1 Key trends
- 6.2 Hardware
- 6.2.1 Intelligent equipment devices
- 6.2.2 Distribution network feeders
- 6.2.3 Others
- 6.3 Software
Chapter 7 Market Size and Forecast, By Service, 2021 - 2034 (USD Million)
- 7.1 Key trends
- 7.2 Partial discharge monitoring
- 7.3 Gas monitoring
- 7.4 Temperature monitoring
- 7.5 Other services
Chapter 8 Market Size and Forecast, By Voltage, 2021 - 2034 (USD Million)
- 8.1 Key trends
- 8.2 Low
- 8.3 Medium
- 8.4 High & extra high
Chapter 9 Market Size and Forecast, By End Use, 2021 - 2034 (USD Million)
- 9.1 Key trends
- 9.2 Utilities
- 9.3 Industrial
- 9.4 Commercial
Chapter 10 Market Size and Forecast, By Region, 2021 - 2034 (USD Million)
- 10.1 Key trends
- 10.2 North America
- 10.2.1 U.S.
- 10.2.2 Canada
- 10.2.3 Mexico
- 10.3 Europe
- 10.3.1 UK
- 10.3.2 France
- 10.3.3 Germany
- 10.3.4 Italy
- 10.3.5 Russia
- 10.3.6 Spain
- 10.4 Asia Pacific
- 10.4.1 China
- 10.4.2 Australia
- 10.4.3 India
- 10.4.4 Japan
- 10.4.5 South Korea
- 10.5 Middle East & Africa
- 10.5.1 Saudi Arabia
- 10.5.2 UAE
- 10.5.3 Turkey
- 10.5.4 South Africa
- 10.5.5 Egypt
- 10.6 Latin America
- 10.6.1 Brazil
- 10.6.2 Argentina
Chapter 11 Company Profiles
- 11.1 ABB
- 11.2 Dynamic Ratings
- 11.3 Eaton
- 11.4 Emerson Electric
- 11.5 General Electric
- 11.6 Hitachi
- 11.7 IPEC LTD.
- 11.8 MEGGER
- 11.9 Mitsubishi Electric
- 11.10 OSENA Innovations
- 11.11 Schneider Electric
- 11.12 SENSEOR
- 11.13 Siemens
- 発行日
- 発行
- Global Market Insights Inc.
- ページ情報
- 英文 121 Pages
- 納期
- 2~3営業日