
|
市場調査レポート
商品コード
1740752
カーボンネガティブ包装の市場機会、成長促進要因、産業動向分析、2025年~2034年予測Carbon-negative Packaging Market Opportunity, Growth Drivers, Industry Trend Analysis, and Forecast 2025 - 2034 |
||||||
カスタマイズ可能
|
|||||||
| カーボンネガティブ包装の市場機会、成長促進要因、産業動向分析、2025年~2034年予測 |
|
出版日: 2025年04月14日
発行: Global Market Insights Inc.
ページ情報: 英文 165 Pages
納期: 2~3営業日
|

全表示
- 概要
- 目次
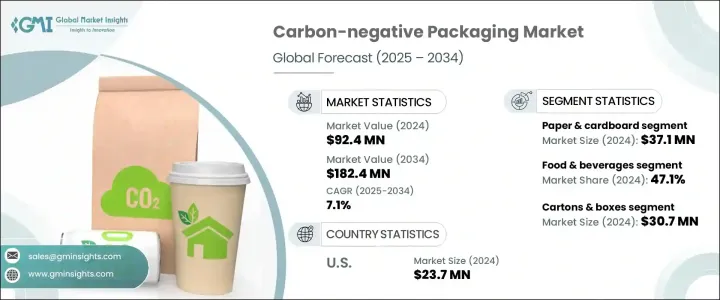
世界のカーボンネガティブ包装市場は、2024年には9,240万米ドルと評価され、バイオベースポリマー、生分解性複合材料、炭素捕捉利用(CCU)の技術革新とともに、プラスチック廃棄物や炭素排出に対する規制圧力の高まりによって、CAGR 7.1%で成長し、2034年には1億8,240万米ドルに達すると推定されます。
持続可能性に対する世界の注目が高まるにつれ、あらゆる業界の企業が環境への影響を最小限に抑えるために包装戦略を再構築しています。包装は依然として企業のカーボンフットプリントの主な要因であり、より環境に優しい代替品への需要が高まる中、企業はカーボンネガティブソリューションを急速に採用しています。
このシフトに拍車をかけているのは、規制の義務化、投資家の期待、そして環境意識の高いブランドを好む消費者の嗜好の進化です。企業は、持続可能なパッケージングを単なるコンプライアンス要件としてではなく、ブランド・ロイヤルティを高め、新たな市場機会を引き出す競争上の優位性として捉えています。より多くの企業がESG(環境、社会、ガバナンス)目標に取り組む中、カーボンネガティブ包装業界は、材料、デザイン、サプライチェーンの最適化におけるイノベーションのために多額の投資流入を目の当たりにしています。ブランドは、カーボンニュートラルやその先を見据えた積極的なステップを踏むことで、環境スチュワードシップがますます成功を定義するマーケットプレースにおいて、自社を強く位置づけることができることに気づきつつあります。
| 市場範囲 | |
|---|---|
| 開始年 | 2024 |
| 予測年 | 2025-2034 |
| 開始金額 | 9,240万米ドル |
| 予測金額 | 1億8,240万米ドル |
| CAGR | 7.1% |
持続可能性が企業の中心的な焦点となるにつれ、包装業界は変貌を遂げつつあります。包装は企業の二酸化炭素排出量に大きく影響するため、多くの企業が環境への影響を減らすための戦略を再検討しています。消費者、投資家、規制機関から、より責任ある慣行を採用するよう圧力が高まっているため、企業はますます環境に優しい代替包装に切り替えるようになっています。そうすることで、ブランドの評判を高めるだけでなく、環境に対する責任へのコミットメントを示すことができます。このような持続可能性への注目の高まりにより、環境に優しいパッケージングソリューションの開発と導入を目的とした投資が急増しています。企業は、生分解性ポリマー、リサイクル可能なプラスチック、板紙など、より循環経済の原則に沿った材料に目を向けています。
市場は材料の種類によって分類され、主なセグメントには生分解性ポリマー、紙・段ボール、バイオベースプラスチック、有機繊維、その他が含まれます。紙と段ボールは、リサイクル可能で入手しやすく、プラスチックを使用しない包装への需要が高まっていることから、2024年には3,710万米ドルと評価される主要材料です。多くの企業、特にeコマース、食品配送、パーソナルケア業界は、持続可能性目標を達成し、環境に優しい包装オプションを求める消費者の需要を満たすために、FSC認証や再生紙ベースの包装を選択しています。
包装の種類には、ボトルや瓶、トレイや容器、カートンや箱、袋やパウチ、包装紙やフィルムなどがあります。2024年には、カートン・箱セグメントは3,070万米ドルを生み出しました。これらの包装材料は、強度、ブランディングの可能性、リサイクル性、炭素隔離能力で人気があります。カートンや箱は、持続可能性が重要なブランド差別化要因であるeコマース、小売、食品サービス分野で特に好まれています。カーボンネガティブな特性は、高品質で環境に優しいパッケージングオプションを提供すると同時に、持続可能性の証明を向上させたいと考えている企業にとって理想的です。
米国のカーボンネガティブ包装市場の2024年の市場規模は2,370万米ドルで、環境に配慮したパッケージングに対する消費者の需要とESG目標に対する企業の強いコミットメントが原動力となっています。州レベルでのプラスチック使用禁止やサプライチェーンの排出量に対する監視強化など、環境に配慮した政策が支持を集める中、ブランドは持続可能なパッケージングを採用する傾向を強めています。このため、既存のパッケージング企業や新興の技術系新興企業が、炭素隔離材料やバイオプラスチックの技術革新に拍車をかけています。
世界のカーボンネガティブ包装業界の主要企業には、Tetra Pak International S.A.、Huhtamaki、Elopak、Footprintなどがあります。これらの企業は、規制の圧力や消費者の嗜好によって高まる持続可能なパッケージングへの需要を満たす最先端のソリューションの開発に注力しています。市場での地位を固めるため、各社はイノベーションとコラボレーションを重視しています。多くの企業が研究開発に多額の投資を行い、バイオベースの新材料を開発し、二酸化炭素排出量を削減する革新的なパッケージングデザインを模索しています。
技術系新興企業との戦略的パートナーシップや、パッケージングの効率と持続可能性を向上させるための継続的な取り組みにより、これらの企業は競合の一歩先を行くことができます。さらに、飲食品、eコマース、化粧品など、特定の業界要件に合わせたカスタマイズ可能なソリューションを含む製品ポートフォリオを拡大している企業もあります。事業戦略を世界な持続可能性の目標に合わせることで、これらの企業は市場の認知度と評判を高め、より幅広い顧客層を引きつけ、急成長するカーボンネガティブ包装分野でのシェアを拡大しています。
目次
第1章 調査手法と範囲
第2章 エグゼクティブサマリー
第3章 業界考察
- エコシステム分析
- バリューチェーンに影響を与える要因
- 利益率分析
- ディスラプション
- 将来の展望
- 製造業者
- 販売代理店
- トランプ政権による関税への影響
- 貿易への影響
- 貿易量の混乱
- 報復措置
- 業界への影響
- 供給側の影響(原材料)
- 主要原材料の価格変動
- サプライチェーンの再構築
- 生産コストへの影響
- 需要側の影響(販売価格)
- 最終市場への価格伝達
- 市場シェアの動向
- 消費者の反応パターン
- 供給側の影響(原材料)
- 影響を受ける主要企業
- 戦略的な業界対応
- サプライチェーンの再構成
- 価格設定と製品戦略
- 政策関与
- 展望と今後の検討事項
- 貿易への影響
- サプライヤーの情勢
- 利益率分析
- 主なニュースと取り組み
- 規制情勢
- 影響要因
- 促進要因
- 炭素排出とプラスチック廃棄物に対する規制圧力
- 企業のESGコミットメントとネットゼロ目標
- バイオベースポリマー、炭素回収利用(CCU)、生分解性複合材料におけるイノベーション
- 循環型経済とゼロウェイストの取り組み
- 環境に優しい包装の需要の高まり
- 業界の潜在的リスク&課題
- 高い生産コストと限られた規模の経済
- パフォーマンスと機能の制限
- 促進要因
- 成長可能性分析
- ポーター分析
- PESTEL分析
第4章 競合情勢
- イントロダクション
- 企業の市場シェア分析
- 競合ポジショニングマトリックス
- 戦略的展望マトリックス
第5章 市場推計・予測:材料別、2021-2034
- 主要動向
- 生分解性ポリマー
- 紙と段ボール
- バイオベースプラスチック
- 有機繊維
- その他
第6章 市場推計・予測:包装形態別、2021-2034
- 主要動向
- ボトルと瓶
- トレイと容器
- カートンと箱
- バッグとポーチ
- 包装紙とフィルム
- その他
第7章 市場推計・予測:最終用途産業別、2021-2034
- 主要動向
- 食品・飲料
- パーソナルケア&化粧品
- ヘルスケアと医薬品
- エレクトロニクス
- その他
第8章 市場推計・予測:地域別、2021-2034
- 主要動向
- 北米
- 米国
- カナダ
- 欧州
- 英国
- ドイツ
- フランス
- イタリア
- スペイン
- ロシア
- アジア太平洋地域
- 中国
- インド
- 日本
- 韓国
- オーストラリア
- ラテンアメリカ
- ブラジル
- メキシコ
- 中東・アフリカ
- 南アフリカ
- サウジアラビア
- アラブ首長国連邦
第9章 企業プロファイル
- 360 Containers
- Bunzl UK Ltd
- Elopak
- Emmerson Packaging
- Footprint
- Genpak
- Georg Utz Holding AG
- Get Bamboo
- Green Side of Pink
- Huhtamaki
- Pregis
- Tetra Pak International S.A.
The Global Carbon-Negative Packaging Market was valued at USD 92.4 million in 2024 and is estimated to grow at a CAGR of 7.1% to reach USD 182.4 million by 2034, driven by increasing regulatory pressure on plastic waste and carbon emissions, along with innovations in bio-based polymers, biodegradable composites, and carbon capture utilization (CCU). As the global focus on sustainability intensifies, businesses across industries are reimagining their packaging strategies to minimize environmental impact. Packaging remains a major contributor to a company's carbon footprint, and with rising demand for greener alternatives, organizations are rapidly adopting carbon-negative solutions.
This shift is fueled by regulatory mandates, investor expectations, and evolving consumer preferences that favor eco-conscious brands. Companies are seeing sustainable packaging not just as a compliance requirement but as a competitive advantage that can boost brand loyalty and unlock new market opportunities. As more companies commit to ESG (Environmental, Social, and Governance) goals, the carbon-negative packaging industry is witnessing significant investment inflows for innovation in materials, design, and supply chain optimization. Brands are realizing that taking proactive steps towards carbon neutrality and beyond can strongly position them in a marketplace where environmental stewardship increasingly defines success.
| Market Scope | |
|---|---|
| Start Year | 2024 |
| Forecast Year | 2025-2034 |
| Start Value | $92.4 Million |
| Forecast Value | $182.4 Million |
| CAGR | 7.1% |
As sustainability becomes a central focus for businesses, the packaging industry is undergoing a transformation. Packaging, being a key contributor to a company's carbon footprint, is now under scrutiny, with many businesses reevaluating their strategies to reduce environmental impact. The growing pressure from consumers, investors, and regulatory bodies to adopt more responsible practices has driven companies to increasingly switch to eco-friendly packaging alternatives. By doing so, they not only enhance their brand reputation but also show a commitment to environmental responsibility. This growing focus on sustainability has led to a surge in investments aimed at developing and implementing green packaging solutions. Businesses are turning to materials such as biodegradable polymers, recyclable plastics, and paperboard, which are more aligned with circular economy principles.
The market is categorized based on material types, with key segments including biodegradable polymers, paper and cardboard, bio-based plastics, organic fibers, and others. Paper and cardboard are the leading materials, valued at USD 37.1 million in 2024, due to their recyclability, availability, and the growing demand for plastic-free packaging. Many businesses, especially e-commerce, food delivery, and personal care industries, opt for FSC-certified and recycled paper-based packaging to meet sustainability targets and satisfy consumer demand for eco-friendly packaging options.
Packaging types include bottles and jars, trays and containers, cartons and boxes, bags and pouches, wrappers and films, and others. In 2024, the cartons and boxes segment generated USD 30.7 million. These packaging materials are popular for their strength, branding potential, and recyclability, as well as their ability to sequester carbon. Cartons and boxes are particularly favored in e-commerce, retail, and food service sectors, where sustainability is a key brand differentiator. Their carbon-negative characteristics make them ideal for companies looking to improve their sustainability credentials while offering a high-quality, eco-friendly packaging option.
The U.S. Carbon-Negative Packaging Market was valued at USD 23.7 million in 2024, driven by consumer demand for environmentally conscious packaging and strong corporate commitments to ESG goals. With eco-friendly policies gaining traction, including state-level plastic bans and heightened scrutiny of supply chain emissions, brands are increasingly adopting sustainable packaging. This has spurred innovation in carbon-sequestering materials and bioplastics from established packaging companies and emerging tech startups.
Key players in the Global Carbon-Negative Packaging Industry include Tetra Pak International S.A., Huhtamaki, Elopak, and Footprint. These companies are focused on developing cutting-edge solutions that meet the growing demand for sustainable packaging driven by regulatory pressures and consumer preferences. To solidify their position in the market, companies emphasize innovation and collaboration. Many invest heavily in research and development to create new bio-based materials and explore innovative packaging designs that reduce carbon emissions.
Strategic partnerships with technology startups, as well as ongoing efforts to improve packaging efficiency and sustainability, allow these companies to stay ahead of the competition. Additionally, some are expanding their product portfolios to include customizable solutions tailored to meet specific industry requirements, such as food and beverage, e-commerce, or cosmetics. By aligning their business strategies with global sustainability goals, these companies are enhancing their market visibility and reputation, attracting a broader customer base, and increasing their share of the rapidly growing carbon-negative packaging sector.
Table of Contents
Chapter 1 Methodology & Scope
- 1.1 Market scope & definitions
- 1.2 Base estimates & calculations
- 1.3 Forecast calculations
- 1.4 Data sources
- 1.4.1 Primary
- 1.4.2 Secondary
- 1.4.2.1 Paid sources
- 1.4.2.2 Public sources
Chapter 2 Executive Summary
- 2.1 Industry synopsis, 2021 - 2034
Chapter 3 Industry Insights
- 3.1 Industry ecosystem analysis
- 3.1.1 Factor affecting the value chain
- 3.1.2 Profit margin analysis
- 3.1.3 Disruptions
- 3.1.4 Future outlook
- 3.1.5 Manufacturers
- 3.1.6 Distributors
- 3.2 Trump administration tariffs
- 3.2.1 Impact on trade
- 3.2.1.1 Trade volume disruptions
- 3.2.1.2 Retaliatory measures
- 3.2.2 Impact on the industry
- 3.2.2.1 Supply-side impact (raw materials)
- 3.2.2.1.1 Price volatility in key materials
- 3.2.2.1.2 Supply chain restructuring
- 3.2.2.1.3 Production cost implications
- 3.2.2.2 Demand-side impact (selling price)
- 3.2.2.2.1 Price transmission to end markets
- 3.2.2.2.2 Market share dynamics
- 3.2.2.2.3 Consumer response patterns
- 3.2.2.1 Supply-side impact (raw materials)
- 3.2.3 Key companies impacted
- 3.2.4 Strategic industry responses
- 3.2.4.1 Supply chain reconfiguration
- 3.2.4.2 Pricing and product strategies
- 3.2.4.3 Policy engagement
- 3.2.5 Outlook and future considerations
- 3.2.1 Impact on trade
- 3.3 Supplier landscape
- 3.4 Profit margin analysis
- 3.5 Key news & initiatives
- 3.6 Regulatory landscape
- 3.7 Impact forces
- 3.7.1 Growth drivers
- 3.7.1.1 Regulatory pressure on carbon emissions and plastic waste
- 3.7.1.2 Corporate ESG commitments and net-zero goals
- 3.7.1.3 Innovations in bio-based polymers, carbon capture utilization (CCU), and biodegradable composites
- 3.7.1.4 Circular economy and zero-waste initiatives
- 3.7.1.5 Growing demand for eco-friendly packaging
- 3.7.2 Industry pitfalls & challenges
- 3.7.2.1 High production costs and limited economies of scale
- 3.7.2.2 Performance and functional limitations
- 3.7.1 Growth drivers
- 3.8 Growth potential analysis
- 3.9 Porter's analysis
- 3.10 PESTEL analysis
Chapter 4 Competitive Landscape, 2024
- 4.1 Introduction
- 4.2 Company market share analysis
- 4.3 Competitive positioning matrix
- 4.4 Strategic outlook matrix
Chapter 5 Market Estimates & Forecast, By Material, 2021 - 2034 (USD Million & Kilo Tons)
- 5.1 Key trends
- 5.2 Biodegradable polymers
- 5.3 Paper & cardboard
- 5.4 Bio-based plastics
- 5.5 Organic fibers
- 5.6 Others
Chapter 6 Market Estimates & Forecast, By Packaging Type, 2021 - 2034 (USD Million & Kilo Tons)
- 6.1 Key trends
- 6.2 Bottles & jars
- 6.3 Trays & containers
- 6.4 Cartons & boxes
- 6.5 Bags & pouches
- 6.6 Wrappers & films
- 6.7 Others
Chapter 7 Market Estimates & Forecast, By End Use Industry, 2021 - 2034 (USD Million & Kilo Tons)
- 7.1 Key trends
- 7.2 Food & beverage
- 7.3 Personal care & cosmetics
- 7.4 Healthcare & pharmaceuticals
- 7.5 Electronics
- 7.6 Others
Chapter 8 Market Estimates & Forecast, By Region, 2021 - 2034 (USD Million & Kilo Tons)
- 8.1 Key trends
- 8.2 North America
- 8.2.1 U.S.
- 8.2.2 Canada
- 8.3 Europe
- 8.3.1 UK
- 8.3.2 Germany
- 8.3.3 France
- 8.3.4 Italy
- 8.3.5 Spain
- 8.3.6 Russia
- 8.4 Asia Pacific
- 8.4.1 China
- 8.4.2 India
- 8.4.3 Japan
- 8.4.4 South Korea
- 8.4.5 Australia
- 8.5 Latin America
- 8.5.1 Brazil
- 8.5.2 Mexico
- 8.6 MEA
- 8.6.1 South Africa
- 8.6.2 Saudi Arabia
- 8.6.3 UAE
Chapter 9 Company Profiles
- 9.1 360 Containers
- 9.2 Bunzl UK Ltd
- 9.3 Elopak
- 9.4 Emmerson Packaging
- 9.5 Footprint
- 9.6 Genpak
- 9.7 Georg Utz Holding AG
- 9.8 Get Bamboo
- 9.9 Green Side of Pink
- 9.10 Huhtamaki
- 9.11 Pregis
- 9.12 Tetra Pak International S.A.

