
|
市場調査レポート
商品コード
1822612
浮体式発電所の市場機会、成長促進要因、産業動向分析、2025年~2034年予測Floating Power Plants Market Opportunity, Growth Drivers, Industry Trend Analysis, and Forecast 2025 - 2034 |
||||||
カスタマイズ可能
|
|||||||
| 浮体式発電所の市場機会、成長促進要因、産業動向分析、2025年~2034年予測 |
|
出版日: 2025年08月29日
発行: Global Market Insights Inc.
ページ情報: 英文 130 Pages
納期: 2~3営業日
|

概要
Global Market Insights, Inc.が発行した最新レポートによると、世界の浮体式発電所市場は2024年に39億米ドルと評価され、2025年の42億米ドルから2034年までには86億米ドルに成長し、CAGR8.2%で拡大すると予測されています。
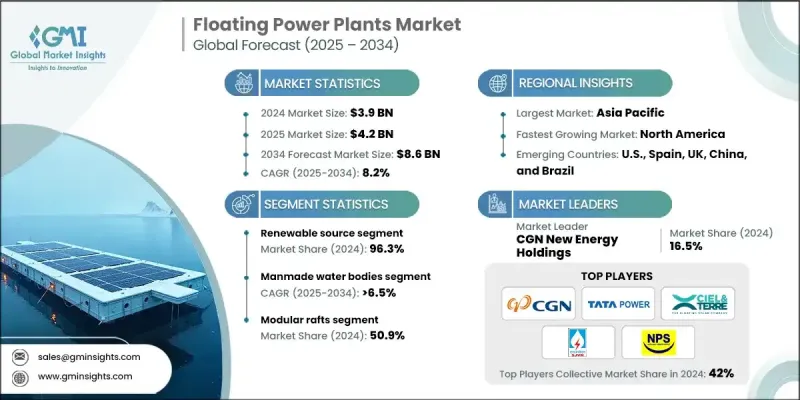
浮体式発電所(FPP)は、水は豊富だが土地が限られている地域のエネルギー需要を満たすための、迅速かつ配備可能で柔軟な選択肢として台頭しています。これらの発電所は、再生可能エネルギー源を統合し、送電ロスを低減し、大量の土地を必要とせずに負荷要件を調整する能力を提供します。
| 市場範囲 | |
|---|---|
| 開始年 | 2024年 |
| 予測年 | 2025年~2034年 |
| 市場金額 | 39億米ドル |
| 予測金額 | 86億米ドル |
| CAGR | 8.2% |
主な促進要因
1.再生可能エネルギー統合の重視:浮体式ソーラー/風力プラットフォームの出現により、各国は限られた土地資源を奪い合うことなくクリーンエネルギーの目標を達成できます。
2.オフショアや島嶼地域での迅速な展開の必要性:送電網を拡張することなく、不利な立場にある沿岸地域や島嶼地域に回復力のあるエネルギーを提供するFPPの能力は計り知れません。
3.土地の制限と水域利用の問題:公共部門は、クリーンな電力を生産するために人工湖や貯水池を利用することを推進しています。
4.モジュラーとハイブリッド技術の進歩:太陽光、風力、貯蔵を利用するハイブリッド浮体式発電プラットフォームの進歩は、ユーティリティ・スケールの自然エネルギーの導入に変革をもたらしつつあります。
主要企業
- 浮体式発電所市場の主要企業は、CGN New Energy Holdings、Tata Power、Ciel &Terre、SJVN Green Energy、National Power Supply Public Companyの5社で、2024年市場の約42%を占めています。
- 2025会計年度第3四半期、Siemens Energyは収益が比較ベースで13.5%増加して113億米ドルとなり、第3四半期の業績が好調であると発表しました。
- 2025年上半期、GE Vernovaは171億米ドルの売上を計上しました。
- 2025年第3四半期、Kawasaki Heavy Industriesは33億米ドルの売上を計上しました。
主な課題:
- 高い導入資本コスト:
- 環境・規制要件:これには、立地に関連する許認可や水利権、特に影響を受けやすい海洋生息地での配備に影響を及ぼす可能性のある環境問題が含まれます。
- あらゆる種類の異常気象におけるメンテナンスと係留:海洋浮体構造物は、塩水による腐食や、風や波の条件に常にさらされることを考慮する必要があります。
1.電源別-再生可能エネルギー
2024年の市場シェアは、再生可能エネルギー(特に太陽光と風力)が独占しました。厳しさを増す環境規制と脱炭素化目標が、電力会社をハイブリッドやソーラー主導の浮体式発電技術へと押し上げています。
2.用途別-人工水域が最前線
簡単な許認可と安定した水位のため、貯水池、池、人工湖、運河などの人工水域が最も目立つ設置場所となっています。このような場所は、潮汐や風波の影響を最小限に抑え、長期的なFPPの実行可能性を維持することができます。
3.展開別-モジュラー・ラフトが機動性を提供
モジュラー・ラフトシステムは、2024年の市場で最も優勢なシステムでした。このシステムは、標準化された製造工程を持つユニットへの移動と動員を提供し、これらのユニットを、グリッド状況だけでなく農村電化プロジェクト向けのユーティリティ・スケールの両方で価値あるものにしています。このアプローチにおける検証は、メンテナンスの低減とアップグレードまでの時間の短縮によっても実現されます。
クリーンエネルギーへの熱望から、北米は急成長市場として認識されています。陸上・洋上風力(米国東海岸)、貯水池ベースの浮体式ソーラー(カリフォルニア州、テキサス州)、その他の分野が、この地域の浮体式発電容量を牽引しています。
浮体式発電所市場の主要ベンダーは、BW Ideol、CGN New Energy Holdings、CHN Energy、Ciel &Terre、Electric Generation Authority、Terre、Electricity Generating Authority of Thailand、Equinor、Floating Power Plant、GE Vernova、HEXA Renewables、Karadeniz Holding、Kawasaki Heavy Industries、MAN Energy Solutions、Mitsubishi Heavy Industries、National Power Supply Public Company、Orsted、RWE、Siemens Energy、SJVN Green Energy、Sterling &Wilson Renewable Energy、Swimsol、Tata Power、Vestas、Wartsilaです。
競争力強化のため、大手各社はハイブリッド・システム、グローバル・パートナーシップ、スケーラブルなモジュール設計を重視しています。BW IdeolとEquinorは、欧州と北米で浮体式洋上風力発電容量を増やしています。Karadeniz Holdingは、新興国での緊急電力供給のために、現在も「パワーシップ」を派遣しています。GE VernovaとSiemens Energyは、浮体式自然エネルギーをガスタービンや蓄電池と統合することを重視しています。VestasとMitsubishi Heavy Industriesのようなコラボレーションは、風力タービンを統合した浮体式プラットフォームを推進しています。各社はまた、地域の規制や気候の要件を満たすように設計された、地域に適合した配備で、人工水域の分野に参入しています。
目次
第1章 調査手法と範囲
第2章 エグゼクティブサマリー
第3章 業界考察
- 業界エコシステム分析
- 原材料の入手可能性と調達分析
- 製造能力評価
- サプライチェーンのレジリエンスとリスク要因
- 配電網解析
- 規制情勢
- 業界への影響要因
- 成長促進要因
- 業界の潜在的リスク・課題
- 成長可能性分析
- ポーター分析
- PESTEL分析
- 浮体式発電所のコスト構造分析
- 価格動向分析
- 地域別
- 容量別
- 新たな機会と動向
- デジタル化とIoTの統合
- 新興市場への浸透
- 投資分析と将来展望
第4章 競合情勢
- イントロダクション
- 企業の市場シェア分析:地域別
- 北米
- 欧州
- アジア太平洋
- 中東・アフリカ
- ラテンアメリカ
- 戦略的ダッシュボード
- 戦略的取り組み
- 主要なパートナーシップとコラボレーション
- 主要なM&A活動
- 製品の革新と発売
- 市場拡大戦略
- 競合ベンチマーキング
- イノベーションとテクノロジーの情勢
第5章 市場規模・予測:電源別、2021年~2034年
- 主要動向
- 再生可能
- 太陽
- 風
- 再生不可能
- ガスタービン
- ICエンジン
第6章 市場規模・予測:容量別、2021年~2034年
- 主要動向
- 1~5MW以上
- 5~20MW以上
- 20~100MW以上
- 100MW以上
第7章 市場規模・予測:展開別、2021年~2034年
- 主要動向
- 船舶
- はしけ
- モジュラーラフト
- その他
第8章 市場規模・予測:用途別、2021年~2034年
- 主要動向
- 人工水域
- 天然水域
第9章 市場規模・予測:地域別、2021年~2034年
- 主要動向
- 北米
- 米国
- カナダ
- メキシコ
- 欧州
- 英国
- ドイツ
- フランス
- スペイン
- アジア太平洋
- 中国
- インド
- 日本
- オーストラリア
- 中東・アフリカ
- アラブ首長国連邦
- サウジアラビア
- ラテンアメリカ
- ブラジル
- アルゼンチン
第10章 企業プロファイル
- BW Ideol
- CGN New Energy Holdings
- CHN Energy
- Ciel &Terre
- Electricity Generating Authority of Thailand
- Equinor
- Floating Power Plant
- GE Vernova
- HEXA Renewables
- Karadeniz Holding
- Kawasaki Heavy Industries
- MAN Energy Solutions
- Mitsubishi Heavy Industries
- National Power Supply Public Company
- Orsted
- RWE
- Siemens Energy
- SJVN Green Energy
- Sterling &Wilson Renewable Energy
- Swimsol
- Tata Power
- Vestas
- Wartsila

