
|
市場調査レポート
商品コード
1716723
清掃製品市場の機会、成長促進要因、産業動向分析、2025年~2034年の予測Cleaning Products Market Opportunity, Growth Drivers, Industry Trend Analysis, and Forecast 2025 - 2034 |
||||||
カスタマイズ可能
|
|||||||
| 清掃製品市場の機会、成長促進要因、産業動向分析、2025年~2034年の予測 |
|
出版日: 2025年03月04日
発行: Global Market Insights Inc.
ページ情報: 英文 120 Pages
納期: 2~3営業日
|

全表示
- 概要
- 目次
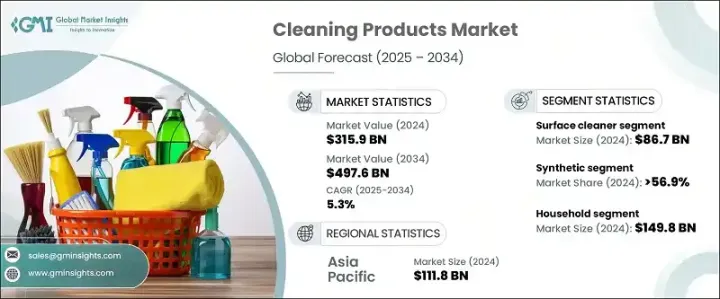
清掃製品の世界市場は2024年に3,159億米ドルに達し、2025年から2034年にかけてCAGR 5.3%で拡大すると予測されています。
特にCOVID-19パンデミック以降、衛生と清潔さが重視されるようになったことが、市場力学に大きな影響を与えています。消費者も企業も同様に衛生を優先しており、住宅、商業、工業の各分野で洗浄ソリューションの需要増につながっています。不衛生に伴う健康リスクへの意識が高まるにつれ、高性能洗浄剤へのニーズは高まり続けています。
CDCのような保健機関は、感染症の蔓延防止における清潔さの重要性を強調し、市場を強力に後押ししています。さらに、急速な都市化と世界化は、特に衛生状態の維持が課題となる人口密集地での需要促進に極めて重要な役割を果たしています。洗浄剤メーカーは、優れた効果を発揮するよう設計された高度な配合を取り入れた革新的なソリューションで対応しています。抗菌剤、抗菌剤、マルチサーフェスクリーナーのイントロダクションは、市場の拡大にさらに拍車をかけています。
| 市場範囲 | |
|---|---|
| 開始年 | 2024 |
| 予測年 | 2025-2034 |
| 開始金額 | 3,159億米ドル |
| 予測金額 | 4,976億米ドル |
| CAGR | 5.3% |
材料科学と化学における技術の進歩も、この業界に革命をもたらしました。各社は、過酷な産業用途から日常的な家庭用まで、さまざまな洗浄要件に対応する専用製品を発売しています。持続可能性が重要な動向として浮上しており、メーカーは生分解性で環境に優しい代替品に投資しています。消費者は、無害で化学物質を含まない清掃製品を積極的に求めており、オーガニックや植物由来の処方の急増につながっています。
清掃製品市場は、表面用クリーナー、トイレ用クリーナー、ガラス・金属用クリーナー、床用クリーナー、布用クリーナー、食器用洗剤など、さまざまなカテゴリーに区分されます。このうち、表面クリーナー分野は2024年に867億米ドルの評価額を記録し、2034年までCAGR 5.7%で成長すると予想されています。消費者が利便性と有効性を優先するため、効率的で即効性のあるソリューションへの需要が高まり続けています。特に商業施設では、殺菌特性を備えた高度な表面クリーナーが広く普及しています。
成分は、合成洗剤と有機洗剤に分かれます。2024年には、合成洗剤セグメントが総売上の56.9%を占め、2025年から2034年にかけてCAGR 4.8%で拡大すると予測されています。合成洗剤は、その費用対効果と強力な洗浄能力により、依然として好まれる選択肢です。化学処方の開発により、メーカーは優れた汚れ落とし、耐久性の延長、表面保護を提供する強化された製品を開発できるようになりました。合成洗剤が市場を独占している一方で、環境問題への懸念や無害な解決策を求める消費者の嗜好により、有機・天然代替品への需要は着実に増加しています。
アジア太平洋は世界の清掃製品市場の35.4%を占め、2024年の市場規模は1,118億米ドルでした。この地域は人口密度が高く、可処分所得の増加も相まって、特に中国、日本、インドなどの国々でクリーニング・ソリューションの需要を牽引し続けています。刺激の強い化学物質の有害性に対する認識が高まるにつれ、環境に優しく生分解性の洗浄剤へのシフトが顕著になっています。現地メーカーは、消費者の嗜好の変化に対応するため、生物に優しい代替品を導入することで、この動向を活用しています。
目次
第1章 調査手法と調査範囲
第2章 エグゼクティブサマリー
第3章 業界洞察
- エコシステム分析
- バリューチェーンに影響を与える要因
- 利益率分析
- ディスラプション
- 将来の展望
- メーカー
- 流通業者
- サプライヤーの状況
- 利益率分析
- 主要ニュースと取り組み
- 規制状況
- 影響要因
- 促進要因
- ナチュラル・オーガニック製品に対する需要の高まり
- 衛生と健康に対する意識の高まり
- 都市化と人口増加
- 業界の潜在的リスク&課題
- 規制遵守と基準
- 消費者の嗜好と動向の変化
- 促進要因
- 成長可能性分析
- ポーター分析
- PESTEL分析
- 消費者行動分析
第4章 競合情勢
- イントロダクション
- 企業シェア分析
- 競合のポジショニング・マトリックス
- 戦略展望マトリックス
第5章 清掃製品市場推計・予測:製品タイプ別、2021年~2034年
- 主要動向
- 表面用クリーナー
- トイレクリーナー
- ガラス・金属クリーナー
- 床用クリーナー
- ファブリッククリーナー
- 食器用洗剤
- その他(パーソナルケアクリーナー、ビルクリーナーなど)
第6章 清掃製品市場推計・予測:成分別、2021年~2034年
- 主要動向
- 有機
- 合成洗剤
第7章 清掃製品市場推定・予測:価格帯別、2021年~2034年
- 主要動向
- エコノミー
- 中価格
- 高価格
第8章 清掃製品市場推計・予測:最終用途別、2021年~2034年
- 主要動向
- 家庭
- 商業施設
- ヘルスケア施設
- ホテル、レストラン、リゾート
- 教育機関
- 商業ランドリー
- その他(倉庫、オフィスなど)
- 産業
第9章 清掃製品市場推計・予測:流通チャネル別、2021年~2034年
- 主要動向
- オンライン
- eコマースサイト
- 企業ウェブサイト
- オフライン
- ハイパーマーケット・スーパーマーケット
- 専門店
- その他小売店
第10章 清掃製品市場推計・予測:地域別、2021年~2034年
- 主要動向
- 北米
- 米国
- カナダ
- 欧州
- 英国
- ドイツ
- フランス
- イタリア
- スペイン
- アジア太平洋
- 中国
- インド
- 日本
- 韓国
- オーストラリア
- マレーシア
- インドネシア
- ラテンアメリカ
- ブラジル
- メキシコ
- 中東・アフリカ
- 南アフリカ
- サウジアラビア
- アラブ首長国連邦
第11章 企業プロファイル
- Azelis
- Blue Wonder
- Bona
- Borer Chemie
- Ecolab
- Henkel
- Hygeniq
- NCH
- Nerta
- Nouryon
- Pollet
- Procter &Gamble
- Reckitt Benckiser
- Solenis
- Unilever
The Global Cleaning Products Market reached USD 315.9 billion in 2024 and is projected to expand at a CAGR of 5.3% between 2025 and 2034. The growing emphasis on hygiene and cleanliness, particularly after the COVID-19 pandemic, has significantly influenced market dynamics. Consumers and businesses alike are prioritizing sanitation, leading to increased demand for cleaning solutions across residential, commercial, and industrial sectors. As people become more conscious of health risks associated with poor hygiene, the need for high-performance cleaning products continues to rise.
The market has seen a strong push from health organizations such as the CDC, emphasizing the importance of cleanliness in preventing the spread of infectious diseases. Additionally, rapid urbanization and globalization have played a pivotal role in driving demand, especially in densely populated regions where maintaining hygiene presents a challenge. Cleaning product manufacturers are responding with innovative solutions, incorporating advanced formulations designed for superior efficacy. The introduction of antimicrobial, antibacterial, and multi-surface cleaners is further fueling market expansion.
| Market Scope | |
|---|---|
| Start Year | 2024 |
| Forecast Year | 2025-2034 |
| Start Value | $315.9 Billion |
| Forecast Value | $497.6 Billion |
| CAGR | 5.3% |
Technological advancements in material science and chemistry have also revolutionized the industry. Companies are launching specialized products catering to different cleaning requirements, from heavy-duty industrial applications to daily household use. Sustainability has emerged as a key trend, with manufacturers investing in biodegradable and eco-friendly alternatives. Consumers are actively seeking non-toxic, chemical-free cleaning products, leading to a surge in organic and plant-based formulations.
The cleaning products market is segmented into various categories, including surface cleaners, toilet cleaners, glass and metal cleaners, floor cleaners, fabric cleaners, and dishwashing products. Among these, the surface cleaners segment amassed a valuation of USD 86.7 billion in 2024 and is expected to grow at a CAGR of 5.7% through 2034. The demand for efficient and fast-acting solutions continues to rise as consumers prioritize convenience and effectiveness. Advanced surface cleaners infused with disinfectant properties have gained widespread popularity, particularly in commercial settings.
In terms of ingredients, the market is divided between synthetic and organic cleaning products. In 2024, the synthetic segment accounted for 56.9% of total revenue and is projected to expand at a CAGR of 4.8% from 2025 to 2034. Synthetic cleaners remain a preferred choice due to their cost-effectiveness and strong cleaning capabilities. Advancements in chemical formulations have enabled manufacturers to develop enhanced products offering superior stain removal, extended durability, and surface protection. While synthetic cleaners dominate the market, the demand for organic and natural alternatives is steadily increasing, driven by environmental concerns and consumer preference for non-toxic solutions.
Asia Pacific accounted for a 35.4% share of the global cleaning products market, valued at USD 111.8 billion in 2024. The region's high population density, coupled with rising disposable income, continues to drive demand for cleaning solutions, particularly in countries such as China, Japan, and India. As awareness about the harmful effects of harsh chemicals grows, there is a noticeable shift toward eco-friendly and biodegradable cleaning products. Local manufacturers are capitalizing on this trend by introducing bio-friendly alternatives to meet evolving consumer preferences.
Table of Contents
Chapter 1 Methodology & Scope
- 1.1 Market scope & definitions
- 1.2 Base estimates & calculations
- 1.3 Forecast calculations
- 1.4 Data sources
- 1.4.1 Primary
- 1.4.2 Secondary
- 1.4.2.1 Paid sources
- 1.4.2.2 Public sources
Chapter 2 Executive Summary
- 2.1 Industry 3600 synopsis, 2021-2034
Chapter 3 Industry Insights
- 3.1 Industry ecosystem analysis
- 3.1.1 Factor affecting the value chain
- 3.1.2 Profit margin analysis
- 3.1.3 Disruptions
- 3.1.4 Future outlook
- 3.1.5 Manufacturers
- 3.1.6 Distributors
- 3.2 Supplier landscape
- 3.3 Profit margin analysis
- 3.4 Key news & initiatives
- 3.5 Regulatory landscape
- 3.6 Impact forces
- 3.6.1 Growth drivers
- 3.6.1.1 Rising demand for natural and organic products
- 3.6.1.2 Increased awareness of hygiene and health
- 3.6.1.3 Urbanization and growing population
- 3.6.2 Industry pitfalls & challenges
- 3.6.2.1 Regulatory compliance and standards
- 3.6.2.2 Changing consumer preferences and trends
- 3.6.1 Growth drivers
- 3.7 Growth potential analysis
- 3.8 Porter's analysis
- 3.9 PESTEL analysis
- 3.10 Consumer behavior analysis
Chapter 4 Competitive Landscape, 2023
- 4.1 Introduction
- 4.2 Company market share analysis
- 4.3 Competitive positioning matrix
- 4.4 Strategic outlook matrix
Chapter 5 Cleaning Products Market Estimates & Forecast, By Product Type, 2021-2034 (USD Billion)
- 5.1 Key trends
- 5.2 Surface cleaners
- 5.3 Toilet cleaners
- 5.4 Glass & metal cleaners
- 5.5 Floor cleaners
- 5.6 Fabric cleaners
- 5.7 Dishwashing products
- 5.8 Others (personal care cleaners, building cleaner, etc.)
Chapter 6 Cleaning Products Market Estimates & Forecast, By Ingredient, 2021-2034 (USD Billion)
- 6.1 Key trends
- 6.2 Organic
- 6.3 Synthetic
Chapter 7 Cleaning Products Market Estimates & Forecast, By Price Range, 2021-2034 (USD Billion)
- 7.1 Key trends
- 7.2 Economy
- 7.3 Medium
- 7.4 High
Chapter 8 Cleaning Products Market Estimates & Forecast, By End Use, 2021-2034 (USD Billion)
- 8.1 Key trends
- 8.2 Household
- 8.3 Commercial
- 8.3.1 Healthcare facilities
- 8.3.2 Hotels, restaurants & resorts
- 8.3.3 Educational institutions
- 8.3.4 Commercial laundry
- 8.3.5 Others (warehouses, office spaces, etc.)
- 8.4 Industrial
Chapter 9 Cleaning Products Market Estimates & Forecast, By Distribution Channel, 2021-2034 (USD Billion)
- 9.1 Key trends
- 9.2 Online
- 9.2.1 E-Commerce sites
- 9.2.2 Company website
- 9.3 Offline
- 9.3.1 Hypermarket & supermarkets
- 9.3.2 Specialty stores
- 9.3.3 Other retail stores
Chapter 10 Cleaning Products Market Estimates & Forecast, By Region, 2021-2034 (USD Billion)
- 10.1 Key trends
- 10.2 North America
- 10.2.1 U.S.
- 10.2.2 Canada
- 10.3 Europe
- 10.3.1 UK
- 10.3.2 Germany
- 10.3.3 France
- 10.3.4 Italy
- 10.3.5 Spain
- 10.4 Asia Pacific
- 10.4.1 China
- 10.4.2 India
- 10.4.3 Japan
- 10.4.4 South Korea
- 10.4.5 Australia
- 10.4.6 Malaysia
- 10.4.7 Indonesia
- 10.5 Latin America
- 10.5.1 Brazil
- 10.5.2 Mexico
- 10.6 MEA
- 10.6.1 South Africa
- 10.6.2 Saudi Arabia
- 10.6.3 UAE
Chapter 11 Company Profiles
- 11.1 Azelis
- 11.2 Blue Wonder
- 11.3 Bona
- 11.4 Borer Chemie
- 11.5 Ecolab
- 11.6 Henkel
- 11.7 Hygeniq
- 11.8 NCH
- 11.9 Nerta
- 11.10 Nouryon
- 11.11 Pollet
- 11.12 Procter & Gamble
- 11.13 Reckitt Benckiser
- 11.14 Solenis
- 11.15 Unilever
