
|
市場調査レポート
商品コード
1716698
ストレージエリアネットワークスイッチ市場の機会、成長促進要因、産業動向分析、2025年~2034年の予測Storage Area Network Switches Market Opportunity, Growth Drivers, Industry Trend Analysis, and Forecast 2025 - 2034 |
||||||
カスタマイズ可能
|
|||||||
| ストレージエリアネットワークスイッチ市場の機会、成長促進要因、産業動向分析、2025年~2034年の予測 |
|
出版日: 2025年03月31日
発行: Global Market Insights Inc.
ページ情報: 英文 190 Pages
納期: 2~3営業日
|

全表示
- 概要
- 目次
ストレージエリアネットワークスイッチの世界市場は、2024年に214億米ドルに達し、2025年から2034年にかけてCAGR 10.8%で成長すると予測されています。
この成長の原動力は、高速5Gネットワークの世界展開、高速光ファイバーの普及、データセンターとクラウドコンピューティングの重要性の高まりです。これらの進歩は、従来のSANストレージシステムから、より洗練された高ポート密度のスイッチング相互接続への移行を企業に促しています。その結果、SANスイッチは、複数のクラウドプラットフォームにまたがるシームレスなデータモビリティを保証するスケーラブルなストレージソリューションを提供する、最新のインフラにとって不可欠なものと考えられるようになりました。
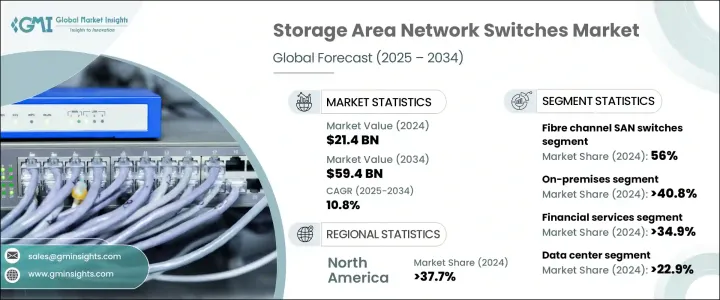
SANスイッチ市場は、主にファイバーチャネルSANスイッチとイーサネットSANスイッチの2種類に分けられます。2024年には、ファイバーチャネルSANスイッチが56%のシェアを占めて市場を独占し、CAGR 12%と最も速い速度で成長すると予測されています。ファイバーチャネルSANスイッチは、特にヘルスケアや金融など、低レイテンシで信頼性の高いストレージソリューションを必要とする分野で、高性能環境向けにますます好まれています。
| 市場範囲 | |
|---|---|
| 開始年 | 2024 |
| 予測年 | 2025-2034 |
| 開始金額 | 214億米ドル |
| 予測金額 | 594億米ドル |
| CAGR | 10.8% |
導入タイプ別に見ると、オンプレミス型、クラウド型、ハイブリッド型に区分されます。2024年の市場シェアは、オンプレミス型が40.8%超で最大であり、クラウドベースのSANスイッチがCAGR 12.4%で急成長する見込みです。オンプレミス市場の2024年の市場規模は87億米ドルで、安全で高性能なストレージが重要なヘルスケアや防衛などの業界における厳格なコンプライアンス規制により、安定した成長を維持すると予測されています。
アプリケーション別では、SANスイッチ市場はデータストレージとバックアップ、仮想化、データセンター、企業ネットワーキング、クラウドコンピューティング、その他に分類されます。データセンターは2024年に全体の22.9%を占める最大の市場シェアを占めており、CAGR 12.6%と最も速い成長が見込まれています。この動向は、ハイパースケールデータセンターにおけるストレージソリューションの需要拡大に関連しており、高性能でエネルギー効率の高いシステムのニーズがその原動力となっています。
最終用途産業では、金融サービスが市場をリードし、2024年の市場シェア全体の34.9%を占め、CAGR 12.2%で最も速い成長が予測されています。金融機関では、高頻度取引やリアルタイムデータ処理などの業務でSANスイッチへの依存度が高まっており、こうした技術に対する需要は今後も高まり続けると予想されます。
地域別では、北米がSANスイッチの最大市場で、2024年の世界シェアの37.7%を占める。一方、アジア太平洋地域が最も急速に成長しており、CAGRは12.2%と予測されています。同地域の急速なデジタル変革がその要因となっています。
目次
第1章 調査手法と調査範囲
第2章 エグゼクティブサマリー
第3章 業界洞察
- エコシステム分析
- ベンダー・マトリックス
- 利益率分析
- テクノロジーとイノベーションの展望
- 特許分析
- 主要ニュースと取り組み
- 業界への影響要因
- 促進要因
- 5Gとファイバーネットワークの拡大
- 自動車用LiDARの統合
- 医療用画像処理需要の増加
- 産業オートメーションとスマート製造
- データセンターとクラウドコンピューティングサービスの拡大
- 業界の潜在的リスク&課題
- 高い資本支出
- 急速な技術の陳腐化
- 促進要因
- 成長可能性分析
- ポーター分析
- PESTEL分析
- 今後の市場動向
- 規制状況
第4章 市場推計・予測:タイプ別、2021年~2034年
- 主要動向
- ファイバーチャネルSANスイッチ
- 4 Gbps
- 8 Gbps
- 16 Gbps
- 32 Gbps
- イーサネットSANスイッチ
- 1 GbE
- 10 GbE
- 25 GbE
- 40 GbE
- 100 GbE
第5章 市場推計・予測:展開タイプ別、2021年~2034年
- 主要動向
- オンプレミス
- クラウド
- ハイブリッド
第6章 市場推計・予測:用途別、2021年~2034年
- 主要動向
- データストレージとバックアップ
- 仮想化
- データセンター
- 企業ネットワーク
- クラウド・コンピューティング
- その他
第7章 市場推計・予測:最終用途産業別、2021年~2034年
- 主要動向
- 金融サービス
- 通信業界
- 政府機関
- メディア・エンターテイメント
- 航空
- その他
第8章 市場推計・予測:地域別、2021年~2034年
- 主要動向
- 北米
- 米国
- カナダ
- 欧州
- ドイツ
- 英国
- フランス
- スペイン
- イタリア
- その他欧州
- アジア太平洋
- 日本
- 中国
- インド
- 韓国
- ニュージーランド
- その他アジア太平洋地域
- ラテンアメリカ
- ブラジル
- メキシコ
- その他ラテンアメリカ
- 中東・アフリカ
- 南アフリカ
- UAE
- サウジアラビア
- その他中東とアフリカ
第9章 企業プロファイル
- Arista Networks, Inc.
- ATTO Technology, Inc.
- Brocade Communications Systems, Inc.
- Cisco Systems, Inc.
- Dell Technologies Inc.
- Extreme Networks, Inc.
- Fortinet, Inc.
- Fujitsu Limited
- Hewlett Packard Enterprise(HPE)Development LP
- Huawei Technologies Co., Ltd.
- IBM Corporation
- Juniper Networks, Inc.
- Lenovo Group Limited
- NEC Corporation
- QLogic Corporation(part of Marvell Technology Group)
The Global Storage Area Network Switches Market reached USD 21.4 billion in 2024 and is expected to grow at a CAGR of 10.8% from 2025 to 2034. This growth is driven by the global rollout of high-speed 5G networks, widespread adoption of high-speed fiber optics, and the growing importance of data centers and cloud computing. These advancements are pushing organizations to move from traditional SAN storage systems to more sophisticated, high-port-density switching interconnects. As a result, SAN switches are now considered essential for modern infrastructures, providing scalable storage solutions that ensure seamless data mobility across multiple cloud platforms.
The market for SAN switches is divided into two primary types: fiber channel SAN switches and Ethernet SAN switches. In 2024, fiber channel SAN switches dominate the market, holding a share of 56%, and are expected to grow at the fastest rate, with a CAGR of 12%. Fiber channel SAN switches are increasingly preferred for high-performance environments, particularly in sectors that require low-latency and reliable storage solutions, such as healthcare and finance.
| Market Scope | |
|---|---|
| Start Year | 2024 |
| Forecast Year | 2025-2034 |
| Start Value | $21.4 Billion |
| Forecast Value | $59.4 Billion |
| CAGR | 10.8% |
By deployment type, the market is segmented into on-premises, cloud-based, and hybrid models. In 2024, the on-premises segment holds the largest market share at over 40.8%, while cloud-based SAN switches are the fastest-growing segment, expected to grow at a CAGR of 12.4%. The on-premises market is valued at USD 8.7 billion in 2024 and is projected to maintain steady growth due to strict compliance regulations in industries such as healthcare and defense, where secure, high-performance storage is critical.
In terms of application, the SAN switches market is categorized into data storage and backup, virtualization, data centers, enterprise networking, cloud computing, and others. Data centers hold the largest market share, accounting for 22.9% of the total in 2024, and are expected to see the fastest growth with a CAGR of 12.6%. This trend is linked to the expanding demand for storage solutions in hyperscale data centers, driven by the need for high-performance and energy-efficient systems.
For end-use industries, financial services lead the market, making up 34.9% of the total market share in 2024, with the fastest growth projected at a CAGR of 12.2%. As financial institutions increasingly rely on SAN switches for tasks such as high-frequency trading and real-time data processing, the demand for these technologies is expected to continue rising.
Geographically, North America is the largest market for SAN switches, accounting for 37.7% of the global share in 2024. Meanwhile, the Asia-Pacific region is experiencing the fastest growth, with a projected CAGR of 12.2%, fueled by the region's rapid digital transformation.
Table of Contents
Chapter 1 Methodology & Scope
- 1.1 Market scope & definitions
- 1.2 Research design
- 1.2.1 Research approach
- 1.2.2 Data collection methods
- 1.3 Base estimates & calculations
- 1.3.1 Base year calculation
- 1.3.2 Key trends for market estimation
- 1.4 Forecast model
- 1.5 Primary research and validation
- 1.5.1 Primary sources
- 1.5.2 Data mining sources
Chapter 2 Executive Summary
- 2.1 Industry 3600 synopsis
Chapter 3 Industry Insights
- 3.1 Industry ecosystem analysis
- 3.2 Vendor matrix
- 3.3 Profit margin analysis
- 3.4 Technology & innovation landscape
- 3.5 Patent analysis
- 3.6 Key news and initiatives
- 3.7 Industry impact forces
- 3.7.1 Growth drivers
- 3.7.1.1 Expansion of 5G and fiber networks
- 3.7.1.2 Automotive LiDAR integration
- 3.7.1.3 Increasing demand for medical imaging
- 3.7.1.4 Industrial automation and smart manufacturing
- 3.7.1.5 Expansion of data centers and cloud computing services.
- 3.7.2 Industry pitfalls & challenges
- 3.7.2.1 High capital expenditure
- 3.7.2.2 Rapid technological obsolescence
- 3.7.1 Growth drivers
- 3.8 Growth potential analysis
- 3.9 Porter's analysis
- 3.10 PESTEL analysis
- 3.11 Future market trends
- 3.12 Regulatory landscape
Chapter 4 Market Estimates and Forecast, By Type, 2021 – 2034 ($ Bn)
- 4.1 Key trends
- 4.2 Fibre channel SAN switches
- 4.2.1 4 Gbps
- 4.2.2 8 Gbps
- 4.2.3 16 Gbps
- 4.2.4 32 Gbps
- 4.3 Ethernet SAN switches
- 4.3.1 1 GbE
- 4.3.2 10 GbE
- 4.3.3 25 GbE
- 4.3.4 40 GbE
- 4.3.5 100 GbE
Chapter 5 Market Estimates and Forecast, By Deployment Type 2021 – 2034 (USD Bn)
- 5.1 Key trends
- 5.2 On-premises
- 5.3 Cloud
- 5.4 Hybrid
Chapter 6 Market Estimates and Forecast, By Application 2021 – 2034 (USD Bn)
- 6.1 Key trends
- 6.2 Data storage and backup
- 6.3 Virtualization
- 6.4 Data centers
- 6.5 Enterprise networking
- 6.6 Cloud computing
- 6.7 Others
Chapter 7 Market Estimates and Forecast, By End Use Industry 2021 – 2034 (USD Bn)
- 7.1 Key trends
- 7.2 Financial services
- 7.3 Telecommunications
- 7.4 Government
- 7.5 Media and entertainment
- 7.6 Aviation
- 7.7 Others
Chapter 8 Market Estimates and Forecast, By Region, 2021– 2034 ($ Bn)
- 8.1 Key trends
- 8.2 North America
- 8.2.1 The U.S.
- 8.2.2 Canada
- 8.3 Europe
- 8.3.1 Germany
- 8.3.2 UK
- 8.3.3 France
- 8.3.4 Spain
- 8.3.5 Italy
- 8.3.6 Rest of Europe
- 8.4 Asia Pacific
- 8.4.1 Japan
- 8.4.2 China
- 8.4.3 India
- 8.4.4 South Korea
- 8.4.5 ANZ
- 8.4.6 Rest of Asia Pacific
- 8.5 Latin America
- 8.5.1 Brazil
- 8.5.2 Mexico
- 8.5.3 Rest of Latin America
- 8.6 Middle East and Africa
- 8.6.1 South Africa
- 8.6.2 UAE
- 8.6.3 Saudi Arabia
- 8.6.4 Rest of Middle East and Africa
Chapter 9 Company Profiles
- 9.1 Arista Networks, Inc.
- 9.2 ATTO Technology, Inc.
- 9.3 Brocade Communications Systems, Inc.
- 9.4 Cisco Systems, Inc.
- 9.5 Dell Technologies Inc.
- 9.6 Extreme Networks, Inc.
- 9.7 Fortinet, Inc.
- 9.8 Fujitsu Limited
- 9.9 Hewlett Packard Enterprise (HPE) Development LP
- 9.10 Huawei Technologies Co., Ltd.
- 9.11 IBM Corporation
- 9.12 Juniper Networks, Inc.
- 9.13 Lenovo Group Limited
- 9.14 NEC Corporation
- 9.15 QLogic Corporation (part of Marvell Technology Group)
