
|
市場調査レポート
商品コード
1699316
自転車シェアリング市場の機会、成長促進要因、産業動向分析、2025年~2034年の予測Bike Sharing Market Opportunity, Growth Drivers, Industry Trend Analysis, and Forecast 2025-2034 |
||||||
カスタマイズ可能
|
|||||||
| 自転車シェアリング市場の機会、成長促進要因、産業動向分析、2025年~2034年の予測 |
|
出版日: 2025年02月20日
発行: Global Market Insights Inc.
ページ情報: 英文 190 Pages
納期: 2~3営業日
|

全表示
- 概要
- 目次
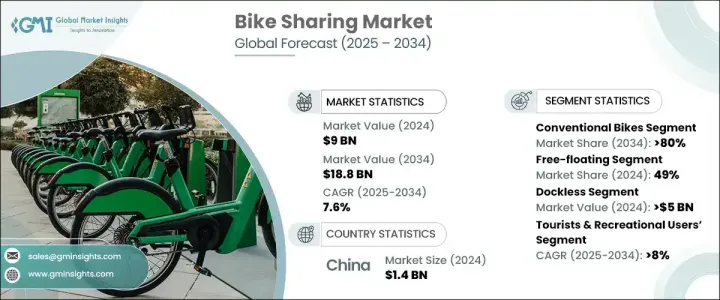
世界の自転車シェアリング市場は2024年に90億米ドルに達し、2025年から2034年にかけてCAGR 7.6%で成長すると予測されています。
世界の都市が環境に優しい交通手段を優先する中、費用対効果が高く持続可能な都市モビリティ・ソリューションに対する需要の高まりが市場拡大の原動力となっています。政府や都市計画担当者は、交通渋滞に対処し二酸化炭素排出を抑制するため、自転車シェアリング・プログラムを積極的に奨励しています。都市化が加速するにつれ、毎日の通勤やレジャー、ラストワンマイルの移動にシェアサイクルを利用する個人が増え、業界の成長に拍車をかけています。
デジタル決済システムとアプリベースの予約プラットフォームの進歩により、サイクルシェアリング・サービスはこれまで以上に利用しやすくなっています。スマートフォンを数回タップするだけで、利用者は即座にレンタサイクルの場所を特定し、ロックを解除し、支払いを済ませることができます。こうしたテクノロジーのシームレスな統合が、特に人口密度の高い大都市圏での普及率を押し上げています。テクノロジー主導のサービス・プロバイダーの存在感が高まることで、市場競争も激化しており、フリートの拡大、メンテナンス、ユーザー・エクスペリエンスの向上への投資が促されています。さらに、バイクシェアリング企業と自治体当局との提携により、サイクリング専用レーンやドッキングステーションといったインフラ整備の機会が生まれています。こうした取り組みは、増加するサイクリストをサポートするだけでなく、安全性と利便性を向上させ、バイクシェアリングを従来の交通手段に代わる実行可能な選択肢にしています。
| 市場範囲 | |
|---|---|
| 開始年 | 2024 |
| 予測年 | 2025-2034 |
| 開始金額 | 90億米ドル |
| 予測金額 | 188億米ドル |
| CAGR | 7.6% |
市場は自転車のタイプ別に従来型自転車とe-bikeに区分され、従来型自転車が市場シェアの80%を占める。従来型自転車は手ごろな価格と最小限のメンテナンスで済むことから、2034年までに140億米ドルの市場規模が見込まれます。充電ステーションやバッテリー交換が必要なe-bikeとは異なり、従来型自転車は、低予算でレンタル料を維持しながらフリートを拡大したい事業者にとって、費用対効果の高いソリューションです。その利用しやすさは、経済的な移動手段を求める毎日の通勤者から、都市の景観を探索するレジャーライダーまで、幅広いユーザー層にアピールします。
シェアリング・システムはフリーフローティング型とステーション型に分類され、2024年にはフリーフローティング型が市場の49%を占める。このモデルは柔軟性が高く、利用者は固定されたドッキングステーションにバイクを返却するのではなく、指定されたサービスエリア内であればどこでもバイクの受け渡しができます。特に、ラストワンマイル接続の課題に悩む都市では、モバイル・アプリで自転車の場所を特定し、ロックを解除できるという利便性が、採用を大幅に増加させています。固定ステーションが不要になることで、サービス・プロバイダーの運営コストも削減され、より広い都市部でカバレッジを拡大することが可能になります。
中国の自転車シェアリング市場は2024年に14億米ドルを生み出し、急速な都市化と環境に優しい交通機関に対する政府の強力な支援により、その牙城を維持しています。同国の広範なインフラとデジタル決済ソリューションの普及により、モバイル・アプリケーションを通じたシームレスな自転車レンタルが可能になりました。当局は、混雑と公害を緩和する持続可能な通勤手段としての自転車利用を強化するため、都市交通網に共有自転車を積極的に組み込んでいます。こうした戦略的な取り組みにより、中国は世界の自転車シェアリング業界におけるリーダーシップを強化し続けています。
目次
第1章 調査手法と調査範囲
- 調査デザイン
- 調査アプローチ
- データ収集方法
- 基本推定と計算
- 基準年の算出
- 市場推計の主要動向
- 予測モデル
- 1次調査と検証
- 市場範囲と定義
第2章 エグゼクティブサマリー
第3章 業界洞察
- エコシステム分析
- サプライヤーの状況
- メーカー
- テクノロジープロバイダー
- 流通業者
- 最終用途
- 利益率分析
- サプライヤーの状況
- 技術とイノベーションの展望
- 特許分析
- 規制状況
- 価格動向
- 使用事例
- 影響要因
- 促進要因
- 世界中で高まる環境と健康への懸念
- 交通渋滞と燃料価格の上昇
- スマートシティの普及
- ドックレス・バイクシェアリングの出現
- 業界の潜在的リスク&課題
- サイクルステーションの開発に伴う高コスト
- 盗難や破壊行為のリスク
- 促進要因
- 成長可能性分析
- ポーター分析
- PESTEL分析
第4章 競合情勢
- イントロダクション
- 企業シェア分析
- 競合のポジショニング・マトリックス
- 戦略展望マトリックス
第5章 市場推計・予測:バイク別、2021年~2034年
- 主要動向
- 従来型自転車
- Eバイク
第6章 市場推計・予測:カテゴリー別、2021年~2034年
- 主要動向
- ドック付き
- ドックレス
第7章 市場推計・予測:シェアリングシステム別、2021年~2034年
- 主要動向
- フリーフローティング
- ステーション型
第8章 市場推計・予測:ビジネスモデル別、2021年~2034年
- 主要動向
- 政府主導型
- 官民パートナーシップ(PPP)
- 完全民間事業者
第9章 市場推計・予測:最終用途別、2021年~2034年
- 主要動向
- 観光客とレクリエーション利用者
- 毎日の通勤者
- 企業利用者
- 大学・キャンパスユーザー
第10章 市場推計・予測:地域別、2021年~2034年
- 主要動向
- 北米
- 米国
- カナダ
- 欧州
- 英国
- ドイツ
- フランス
- スペイン
- イタリア
- ロシア
- 北欧
- アジア太平洋
- 中国
- インド
- 日本
- 韓国
- ニュージーランド
- 東南アジア
- ラテンアメリカ
- ブラジル
- メキシコ
- アルゼンチン
- 中東・アフリカ
- UAE
- 南アフリカ
- サウジアラビア
第11章 企業プロファイル
- Bird
- Bixi
- Bluegogo
- Bolt
- Capital Bikeshare
- Chartered Bike
- Citi Bike NYC
- Divvy
- Dott
- Ford GoBike
- GrabTaxi Holdings
- JCDecaux Group
- JUMP
- Lime
- Lyft
- Nextbike
- Ofo
- SG Bike
- Spin
- Tembici
- Youon Bike
The Global Bike Sharing Market reached USD 9 billion in 2024 and is projected to grow at a CAGR of 7.6% between 2025 and 2034. The rising demand for cost-effective and sustainable urban mobility solutions is driving market expansion as cities worldwide prioritize eco-friendly transportation. Governments and city planners are actively encouraging bike-sharing programs to address traffic congestion and curb carbon emissions. As urbanization accelerates, more individuals are embracing shared bicycles for daily commuting, leisure, and last-mile connectivity, fueling industry growth.
Advancements in digital payment systems and app-based booking platforms have made bike-sharing services more accessible than ever. With just a few taps on a smartphone, users can locate, unlock, and pay for bike rentals instantly. This seamless integration of technology is boosting adoption rates, particularly in densely populated metropolitan areas. The growing presence of tech-driven service providers is also intensifying market competition, prompting investments in fleet expansion, maintenance, and user experience enhancements. Additionally, partnerships between bike-sharing companies and municipal authorities are creating opportunities for infrastructure development, such as dedicated cycling lanes and docking stations. These initiatives not only support the rising number of cyclists but also enhance safety and convenience, making bike-sharing a viable alternative to traditional transit options.
| Market Scope | |
|---|---|
| Start Year | 2024 |
| Forecast Year | 2025-2034 |
| Start Value | $9 Billion |
| Forecast Value | $18.8 Billion |
| CAGR | 7.6% |
The market is segmented by bike type into conventional bicycles and e-bikes, with conventional bicycles accounting for 80% of the market share. This segment is expected to generate USD 14 billion by 2034 as traditional bicycles continue to dominate due to their affordability and minimal maintenance requirements. Unlike e-bikes, which require charging stations and battery replacements, conventional bicycles are a cost-effective solution for operators looking to expand their fleets while maintaining budget-friendly rental fees. Their accessibility appeals to a broad user base, from daily commuters seeking an economical travel option to leisure riders exploring urban landscapes.
The sharing system is categorized into free-floating and station-based models, with free-floating bike-sharing capturing 49% of the market in 2024. This model offers greater flexibility, allowing users to pick up and drop off bikes anywhere within a designated service area rather than returning them to fixed docking stations. The convenience of locating and unlocking a bike via a mobile app has significantly increased adoption, especially in cities struggling with last-mile connectivity challenges. The elimination of fixed stations also reduces operational costs for service providers, enabling them to expand their coverage across larger urban areas.
China bike sharing market generated USD 1.4 billion in 2024, maintaining its stronghold due to rapid urbanization and robust government support for eco-friendly transportation. The country's extensive infrastructure and widespread adoption of digital payment solutions have made bike rentals seamless through mobile applications. Authorities are actively integrating shared bicycles into urban transportation networks, reinforcing cycling as a sustainable commuting option to alleviate congestion and pollution. These strategic initiatives continue to strengthen China's leadership in the global bike-sharing industry.
Table of Contents
Chapter 1 Methodology & Scope
- 1.1 Research design
- 1.1.1 Research approach
- 1.1.2 Data collection methods
- 1.2 Base estimates & calculations
- 1.2.1 Base year calculation
- 1.2.2 Key trends for market estimation
- 1.3 Forecast model
- 1.4 Primary research and validation
- 1.4.1 Primary sources
- 1.4.2 Data mining sources
- 1.5 Market scope & definition
Chapter 2 Executive Summary
- 2.1 Industry 3600 synopsis, 2021 - 2034
Chapter 3 Industry Insights
- 3.1 Industry ecosystem analysis
- 3.1.1 Supplier landscape
- 3.1.1.1 Manufacturers
- 3.1.1.2 Technology providers
- 3.1.1.3 Distributors
- 3.1.1.4 End use
- 3.1.2 Profit margin analysis
- 3.1.1 Supplier landscape
- 3.2 Technology & innovation landscape
- 3.3 Patent analysis
- 3.4 Regulatory landscape
- 3.5 Price trend
- 3.6 Use cases
- 3.7 Impact forces
- 3.7.1 Growth drivers
- 3.7.1.1 Growing environmental & health concerns across the globe
- 3.7.1.2 Rise in traffic congestion and increased fuel prices
- 3.7.1.3 Proliferation of smart cities
- 3.7.1.4 Emergence of dock less bike sharing
- 3.7.2 Industry pitfalls & challenges
- 3.7.2.1 High cost associated with the development of bike-stations
- 3.7.2.2 Risks of theft and vandalism
- 3.7.1 Growth drivers
- 3.8 Growth potential analysis
- 3.9 Porter's analysis
- 3.10 PESTEL analysis
Chapter 4 Competitive Landscape, 2024
- 4.1 Introduction
- 4.2 Company market share analysis
- 4.3 Competitive positioning matrix
- 4.4 Strategic outlook matrix
Chapter 5 Market Estimates & Forecast, By Bike, 2021 - 2034 ($Bn, Fleet Size)
- 5.1 Key trends
- 5.2 Conventional bike
- 5.3 E-bike
Chapter 6 Market Estimates & Forecast, By Category, 2021 - 2034 ($Bn, Fleet Size)
- 6.1 Key trends
- 6.2 Docked
- 6.3 Dockless
Chapter 7 Market Estimates & Forecast, By Sharing System, 2021 - 2034 ($Bn, Fleet Size)
- 7.1 Key trends
- 7.2 Free-floating
- 7.3 Station-based
Chapter 8 Market Estimates & Forecast, By Business Model, 2021 - 2034 ($Bn, Fleet Size)
- 8.1 Key trends
- 8.2 Government-sponsored
- 8.3 Public-private partnerships (PPP)
- 8.4 Fully private operators
Chapter 9 Market Estimates & Forecast, By End Use, 2021 - 2034 ($Bn, Fleet Size)
- 9.1 Key trends
- 9.2 Tourists & recreational users
- 9.3 Daily commuters
- 9.4 Corporate users
- 9.5 University & campus users
Chapter 10 Market Estimates & Forecast, By Region, 2021 - 2034 ($Bn, Fleet Size)
- 10.1 Key trends
- 10.2 North America
- 10.2.1 U.S.
- 10.2.2 Canada
- 10.3 Europe
- 10.3.1 UK
- 10.3.2 Germany
- 10.3.3 France
- 10.3.4 Spain
- 10.3.5 Italy
- 10.3.6 Russia
- 10.3.7 Nordics
- 10.4 Asia Pacific
- 10.4.1 China
- 10.4.2 India
- 10.4.3 Japan
- 10.4.4 South Korea
- 10.4.5 ANZ
- 10.4.6 Southeast Asia
- 10.5 Latin America
- 10.5.1 Brazil
- 10.5.2 Mexico
- 10.5.3 Argentina
- 10.6 MEA
- 10.6.1 UAE
- 10.6.2 South Africa
- 10.6.3 Saudi Arabia
Chapter 11 Company Profiles
- 11.1 Bird
- 11.2 Bixi
- 11.3 Bluegogo
- 11.4 Bolt
- 11.5 Capital Bikeshare
- 11.6 Chartered Bike
- 11.7 Citi Bike NYC
- 11.8 Divvy
- 11.9 Dott
- 11.10 Ford GoBike
- 11.11 GrabTaxi Holdings
- 11.12 JCDecaux Group
- 11.13 JUMP
- 11.14 Lime
- 11.15 Lyft
- 11.16 Nextbike
- 11.17 Ofo
- 11.18 SG Bike
- 11.19 Spin
- 11.20 Tembici
- 11.21 Youon Bike
