
|
市場調査レポート
商品コード
1699248
港湾設備市場の機会、成長促進要因、産業動向分析、2025年~2034年の予測Port Equipment Market Opportunity, Growth Drivers, Industry Trend Analysis, and Forecast 2025-2034 |
||||||
カスタマイズ可能
|
|||||||
| 港湾設備市場の機会、成長促進要因、産業動向分析、2025年~2034年の予測 |
|
出版日: 2025年02月17日
発行: Global Market Insights Inc.
ページ情報: 英文 170 Pages
納期: 2~3営業日
|

全表示
- 概要
- 目次
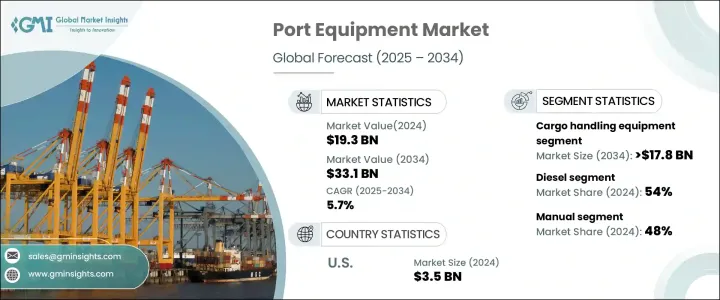
世界の港湾設備市場は2024年に193億米ドルと評価され、2025年から2034年にかけてCAGR 5.7%で成長すると予測されています。
国際貿易とコンテナ貨物の増加により、先進的な港湾インフラと効率的な荷役システムへの需要が高まっています。世界のサプライチェーンの拡大により、より大型の船舶に対応し、業務効率を改善できる近代的な港湾設備の必要性が高まっています。ターンアラウンドタイムを強化し、人的介入を減らすため、港湾は自動荷役システム、人工知能、IoTベースの物流ソリューションを統合しています。
リアルタイムの監視、安全性の強化、シームレスな物流管理のニーズが高まり続けているため、港湾の自動化とスマートインフラへの投資が増加しています。政府部門と民間部門の両方が港湾のアップグレードに多大な資源を割いており、特に発展途上地域では大水深ターミナルや大容量貯蔵システムの開発が進んでいます。港湾の運営を合理化し、より大量の貨物を効率的に管理することを目指しているため、ガントリークレーン、船舶対陸上クレーン、自動誘導車の需要が高まっています。
| 市場範囲 | |
|---|---|
| 開始年 | 2024 |
| 予測年 | 2025-2034 |
| 開始金額 | 193億米ドル |
| 予測金額 | 331億米ドル |
| CAGR | 5.7% |
市場は、機器タイプ、推進、操作によって区分されます。荷役機器は市場シェアの45%以上を占め、2034年までに178億米ドルを超えると予測されます。コンテナ貨物の急速な増加により、船舶対陸上クレーン、ゴムタイヤ式ガントリークレーン、ストラドルキャリア、リーチスタッカーのニーズが高まっています。効率的な荷役機器は、港湾のバース占有時間を短縮し、船舶のターンアラウンド率を最大化するのに役立ちます。自動スタッキング・クレーンやターミナル・トラクターなどの自動化ソリューションが人気を集めており、生産性の向上と遅延の最小化を実現しています。
推進タイプ別に見ると、市場はディーゼル、電気、ハイブリッドに分類されます。ディーゼル式港湾機器は2024年の市場シェアの54%を占めました。リーチスタッカー、ストラドルキャリア、ゴムタイヤ式ガントリークレーンは、その高トルクと負荷処理能力により、主にディーゼルエンジンに依存しています。ディーゼルエンジン駆動の機器は、安定した操業を保証するため、バルク材や重量貨物を扱う港湾では依然として好ましい選択肢です。電動化が注目されている一方で、バッテリー駆動システムへの移行は、高コスト、限られた吊り上げ能力、充電時間の延長などの課題に直面しています。ディーゼル燃料が利用可能で、給油インフラが確立していることが、ディーゼル燃料の優位性をさらに支えています。多くの港湾、特に新興経済諸国では、LNGや水素のような代替燃料供給ソリューションがまだ導入されておらず、ディーゼル機器が最前線に君臨しています。
操作に基づき、市場は手動、半自動、全自動セグメントに分けられます。2024年の市場シェアは、手動式港湾機器が48%を占めています。フォークリフト、移動式クレーン、手動式リーチスタッカーは、初期投資とメンテナンスコストが低いため、特に中小規模の港湾で依然として広く使用されています。自動化されたシステムとは異なり、手動機器は、不規則な形状の貨物やブレークバルク貨物を含む多様な種類の貨物を取り扱う上で、より高い柔軟性を提供します。開発途上地域は自動化よりも貿易インフラの拡充を優先するため、手動式港湾設備の需要が持続しています。
北米は世界市場をリードしており、米国は2024年に35億米ドルを生み出します。同地域では、港湾の近代化と先進的な荷役システムへの投資が続いており、市場の成長を後押ししています。
目次
第1章 調査手法と調査範囲
- 調査デザイン
- 調査アプローチ
- データ収集方法
- 基本推定と計算
- 基準年の算出
- 市場推計の主要動向
- 予測モデル
- 1次調査と検証
- 市場範囲と定義
第2章 エグゼクティブサマリー
第3章 業界洞察
- エコシステム分析
- サプライヤーの状況
- メーカー
- テクノロジープロバイダー
- サービスプロバイダー
- 最終用途
- 利益率分析
- サプライヤーの状況
- 技術とイノベーションの展望
- 特許分析
- 規制状況
- コスト内訳分析
- 価格動向
- 影響要因
- 促進要因
- 世界貿易とコンテナ化の成長
- 港湾の自動化とデジタル化
- 港湾の拡張と近代化
- バルク貨物ハンドリングの需要増加
- 環境規制とグリーンポートへの取り組み
- 業界の潜在的リスク&課題
- 高い初期投資コスト
- 港湾の混雑と容量の制約
- 促進要因
- 成長可能性分析
- ポーター分析
- PESTEL分析
第4章 競合情勢
- イントロダクション
- 企業シェア分析
- 競合のポジショニング・マトリックス
- 戦略展望マトリックス
第5章 市場推計・予測:機器別、2021年~2034年
- 主要動向
- 荷役機器
- シップ・ツー・ショア(STS)クレーン
- ゴムタイヤ式ガントリー(RTG)クレーン
- ストラドルキャリア
- その他
- バルクマテリアルハンドリング機器
- シップローダー&アンローダー
- ホッパー&グラブ
- コンベヤーシステム
- バケットホイールリクレーマー
- 港湾インフラ設備
- 係留システム
- 浚渫設備
- フローティングクレーン
- ウインチ&キャプスタン
第6章 市場推計・予測:操作別、2021年~2034年
- 主要動向
- 手動式
- 半自動
- 全自動
第7章 市場推計・予測:推進別、2021年~2034年
- 主要動向
- ディーゼル
- 電気
- ハイブリッド
第8章 市場推計・予測:地域別、2021年~2034年
- 主要動向
- 北米
- 米国
- カナダ
- 欧州
- 英国
- ドイツ
- フランス
- イタリア
- スペイン
- ロシア
- 北欧
- アジア太平洋
- 中国
- インド
- 日本
- オーストラリア
- 韓国
- 東南アジア
- ラテンアメリカ
- ブラジル
- メキシコ
- アルゼンチン
- 中東・アフリカ
- UAE
- 南アフリカ
- サウジアラビア
第9章 企業プロファイル
- Anhui Heli
- CVS Ferrari
- Doosan Industrial Vehicle
- Gottwald Port Technology
- Hyster-Yale Materials Handling
- Hyundai Heavy Industries
- JCB
- Kalmar
- Konecranes
- Liebherr Group
- Lonking Holdings Limited
- Manitou Group
- Marine Travelift
- Mitsubishi Logisnext
- Sany Heavy Industry
- Shanghai Zhenhua Heavy Industries(ZPMC)
- Terex
- Toyota Industries
- TTS Group ASA
- Zoomlion Heavy Industry Science &Technology
The Global Port Equipment Market was valued at USD 19.3 billion in 2024 and is projected to grow at a CAGR of 5.7% from 2025 to 2034. Increasing international trade and containerized cargo are driving demand for advanced port infrastructure and efficient cargo handling systems. The expansion of global supply chains has heightened the need for modern port equipment that can accommodate larger vessels and improve operational efficiency. To enhance turnaround times and reduce human intervention, ports are integrating automated cargo handling systems, artificial intelligence, and IoT-based logistics solutions.
Investments in port automation and smart infrastructure are increasing as the need for real-time monitoring, enhanced safety, and seamless logistics management continues to rise. Both government and private sectors are allocating substantial resources to upgrade ports, particularly in developing regions, where deep-water terminals and high-capacity storage systems are being developed. Demand for gantry cranes, ship-to-shore cranes, and automated guided vehicles is rising as ports aim to streamline operations and manage higher cargo volumes efficiently.
| Market Scope | |
|---|---|
| Start Year | 2024 |
| Forecast Year | 2025-2034 |
| Start Value | $19.3 Billion |
| Forecast Value | $33.1 Billion |
| CAGR | 5.7% |
The market is segmented by equipment type, propulsion, and operation. Cargo handling equipment held over 45% of the market share and is projected to surpass USD 17.8 billion by 2034. The rapid growth of containerized cargo has increased the need for ship-to-shore cranes, rubber-tired gantry cranes, straddle carriers, and reach stackers. Efficient cargo handling equipment helps ports reduce berth occupation times and maximize ship turnaround rates. Automated solutions such as automatic stacking cranes and terminal tractors are gaining traction, improving productivity and minimizing delays.
By propulsion type, the market is categorized into diesel, electric, and hybrid. Diesel-powered port equipment accounted for 54% of the market share in 2024. Reach stackers, straddle carriers, and rubber-tired gantry cranes primarily rely on diesel engines due to their high torque and load-handling capabilities. Diesel-powered equipment remains the preferred choice for ports handling bulk materials and heavy cargo, as it ensures uninterrupted operations. While electrification is gaining attention, the transition to battery-powered systems faces challenges, including high costs, limited lifting capacity, and extended charging times. The availability of diesel fuel and well-established fueling infrastructure further supports its dominance. Many ports, particularly in developing economies, have yet to implement alternative fueling solutions such as LNG and hydrogen, keeping diesel equipment at the forefront.
Based on operation, the market is divided into manual, semi-automated, and fully automated segments. Manual port equipment held a 48% market share in 2024. Forklifts, mobile cranes, and manually operated reach stackers remain widely used, especially in small and medium-sized ports, due to lower initial investment and maintenance costs. Unlike automated systems, manual equipment offers greater flexibility in handling diverse cargo types, including irregularly shaped goods and breakbulk shipments. Developing regions prioritize trade infrastructure expansion over automation, leading to sustained demand for manual port equipment.
North America leads the global market, with the United States generating USD 3.5 billion in 2024. The region's ongoing investments in port modernization and advanced cargo handling systems continue to fuel market growth.
Table of Contents
Chapter 1 Methodology & Scope
- 1.1 Research design
- 1.1.1 Research approach
- 1.1.2 Data collection methods
- 1.2 Base estimates & calculations
- 1.2.1 Base year calculation
- 1.2.2 Key trends for market estimation
- 1.3 Forecast model
- 1.4 Primary research and validation
- 1.4.1 Primary sources
- 1.4.2 Data mining sources
- 1.5 Market scope & definition
Chapter 2 Executive Summary
- 2.1 Industry 3600 synopsis, 2021 - 2034
Chapter 3 Industry Insights
- 3.1 Industry ecosystem analysis
- 3.1.1 Supplier landscape
- 3.1.1.1 Manufacturers
- 3.1.1.2 Technology providers
- 3.1.1.3 Service providers
- 3.1.1.4 End use
- 3.1.2 Profit margin analysis
- 3.1.1 Supplier landscape
- 3.2 Technology & innovation landscape
- 3.3 Patent analysis
- 3.4 Regulatory landscape
- 3.5 Cost breakdown analysis
- 3.6 Price trend
- 3.7 Impact forces
- 3.7.1 Growth drivers
- 3.7.1.1 Growth in global trade & containerization
- 3.7.1.2 Port automation & digitalization
- 3.7.1.3 Expansion & modernization of ports
- 3.7.1.4 Increasing demand for bulk cargo handling
- 3.7.1.5 Environmental regulations & green port initiatives
- 3.7.2 Industry pitfalls & challenges
- 3.7.2.1 High initial investment costs
- 3.7.2.2 Port congestion and capacity constraints
- 3.7.1 Growth drivers
- 3.8 Growth potential analysis
- 3.9 Porter's analysis
- 3.10 PESTEL analysis
Chapter 4 Competitive Landscape, 2024
- 4.1 Introduction
- 4.2 Company market share analysis
- 4.3 Competitive positioning matrix
- 4.4 Strategic outlook matrix
Chapter 5 Market Estimates & Forecast, By Equipment, 2021 - 2034 ($Bn, Units)
- 5.1 Key trends
- 5.2 Cargo handling equipment
- 5.2.1 Ship-to-shore (STS) cranes
- 5.2.2 Rubber-tired gantry (RTG) cranes
- 5.2.3 Straddle carrier
- 5.2.4 Others
- 5.3 Bulk material handling equipment
- 5.3.1 Ship loaders & unloaders
- 5.3.2 Hoppers & grabs
- 5.3.3 Conveyor systems
- 5.3.4 Bucket wheel reclaimers
- 5.4 Port infrastructure equipment
- 5.4.1 Mooring systems
- 5.4.2 Dredging equipment
- 5.4.3 Floating cranes
- 5.4.4 Winches & capstans
Chapter 6 Market Estimates & Forecast, By Operation, 2021 - 2034 ($Bn, Units)
- 6.1 Key trends
- 6.2 Manual
- 6.3 Semi-automated
- 6.4 Fully automated
Chapter 7 Market Estimates & Forecast, By Propulsion, 2021 - 2034 ($Bn, Units)
- 7.1 Key trends
- 7.2 Diesel
- 7.3 Electric
- 7.4 Hybrid
Chapter 8 Market Estimates & Forecast, By Region, 2021 - 2034 ($Bn, Units)
- 8.1 Key trends
- 8.2 North America
- 8.2.1 U.S.
- 8.2.2 Canada
- 8.3 Europe
- 8.3.1 UK
- 8.3.2 Germany
- 8.3.3 France
- 8.3.4 Italy
- 8.3.5 Spain
- 8.3.6 Russia
- 8.3.7 Nordics
- 8.4 Asia Pacific
- 8.4.1 China
- 8.4.2 India
- 8.4.3 Japan
- 8.4.4 Australia
- 8.4.5 South Korea
- 8.4.6 Southeast Asia
- 8.5 Latin America
- 8.5.1 Brazil
- 8.5.2 Mexico
- 8.5.3 Argentina
- 8.6 MEA
- 8.6.1 UAE
- 8.6.2 South Africa
- 8.6.3 Saudi Arabia
Chapter 9 Company Profiles
- 9.1 Anhui Heli
- 9.2 CVS Ferrari
- 9.3 Doosan Industrial Vehicle
- 9.4 Gottwald Port Technology
- 9.5 Hyster-Yale Materials Handling
- 9.6 Hyundai Heavy Industries
- 9.7 JCB
- 9.8 Kalmar
- 9.9 Konecranes
- 9.10 Liebherr Group
- 9.11 Lonking Holdings Limited
- 9.12 Manitou Group
- 9.13 Marine Travelift
- 9.14 Mitsubishi Logisnext
- 9.15 Sany Heavy Industry
- 9.16 Shanghai Zhenhua Heavy Industries (ZPMC)
- 9.17 Terex
- 9.18 Toyota Industries
- 9.19 TTS Group ASA
- 9.20 Zoomlion Heavy Industry Science & Technology
