
|
市場調査レポート
商品コード
1698249
ピンチチューブバルブ市場の機会、成長促進要因、産業動向分析、2025年~2034年の予測Pinch Tube Valve Market Opportunity, Growth Drivers, Industry Trend Analysis, and Forecast 2025 - 2034 |
||||||
カスタマイズ可能
|
|||||||
| ピンチチューブバルブ市場の機会、成長促進要因、産業動向分析、2025年~2034年の予測 |
|
出版日: 2025年02月27日
発行: Global Market Insights Inc.
ページ情報: 英文 204 Pages
納期: 2~3営業日
|

全表示
- 概要
- 目次
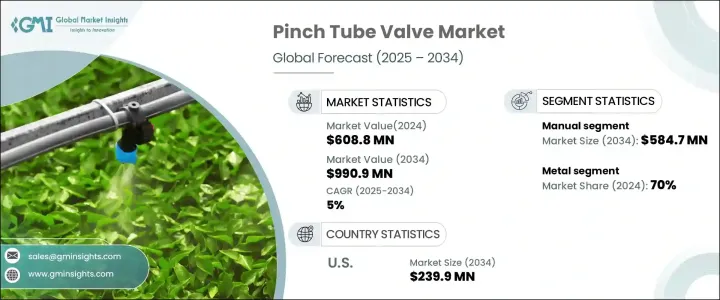
ピンチチューブバルブの世界市場は、2024年に6億880万米ドルと評価され、2025年から2034年にかけてCAGR 5%で成長すると予測されています。
医薬品、飲食品、化学、バイオテクノロジーなどの主要産業で、精密な流体制御と衛生的な自動化のニーズが高まっていることが、市場の大幅な拡大を後押ししています。これらの産業は、効率を高め、厳しい衛生基準を維持し、規制コンプライアンスを満たすために、高度な流体管理ソリューションに大きく依存しています。
自動化が産業成長の礎となるにつれ、ピンチチューブバルブの需要は増加の一途をたどっており、汚染のない効率的な流体処理を保証しています。さらに、バルブの設計と材料における技術的進歩は、耐久性、性能、適応性を向上させ、様々な分野への市場浸透にさらに拍車をかけています。持続可能性とエネルギー効率への関心の高まりも、産業界に最小限のメンテナンス、運用コストの削減、優れた流体制御を提供するピンチチューブバルブの採用を促しています。自動化とプロセスの最適化に対する投資の増加に伴い、市場は今後数年間で安定した成長を遂げる見込みです。
| 市場範囲 | |
|---|---|
| 開始年 | 2024 |
| 予測年 | 2025-2034 |
| 開始金額 | 6億880万米ドル |
| 予測金額 | 9億9,090万米ドル |
| CAGR | 5% |
ピンチチューブバルブ市場は、作動タイプによって主に手動バルブと自動バルブに区分されます。2024年には、手動ピンチチューブバルブが最大の市場シェアを占め、3億6,400万米ドルに達します。その広範な採用は、シンプルさ、費用対効果、メンテナンスの容易さに起因しています。中小企業や自動化の初期段階にある産業は、自動化システムの複雑さやコストを伴わない信頼性の高い流体制御のために手動ピンチバルブを好みます。これらのバルブは、常時大量に自動化する必要はないが、精密な流体ハンドリングが不可欠な用途で広く使用されています。
ピンチチューブバルブ市場は、材料の種類によって、金属、プラスチック、その他の材料に分類されます。金属製バルブが2024年の市場で70%のシェアを占めました。ステンレス、真鍮、アルミ製のピンチバルブは、耐久性に優れ、過酷な使用条件にも耐え、高圧にも耐えられることから好まれています。医薬品、化学処理、石油・ガスなどの産業は、侵食性の化学物質、高温、厳しい安全要件を含む極端な環境での信頼性により、金属製バルブを選ぶ。耐腐食性で高性能なバルブソリューションへの需要は、産業用アプリケーション全体で金属製ピンチチューブバルブの採用を推進し続けています。
米国のピンチチューブバルブ市場は、自動化とプロセス制御技術の採用拡大により、2024年には1億4,140万米ドルと評価されました。食品加工、製薬、水処理などの業界では、精密で汚染のない流体制御を必要とする自動化システムの導入が増加しています。ピンチチューブバルブは、このような分野での業務効率、信頼性、衛生基準の遵守を確保する上で重要な役割を担っています。精度が高く、メンテナンスが容易で耐久性のあるバルブ・ソリューションへのニーズが高まるにつれ、米国市場は安定した成長を遂げると予想されます。
目次
第1章 調査手法と調査範囲
- 市場範囲と定義
- 基本推定と計算
- 予測計算
- データソース
- 1次データ
- 二次資料
- 有料情報源
- 公的情報源
第2章 エグゼクティブサマリー
第3章 業界洞察
- エコシステム分析
- バリューチェーンに影響を与える要因
- 利益率分析
- 破壊
- 将来の展望
- メーカー
- 流通業者
- 技術進歩分析
- 規制状況
- 影響要因
- 促進要因
- 化学市場の成長
- 高性能用途への需要の増加
- 石油・ガス市場の拡大
- 業界の潜在的リスク&課題
- 市場の飽和
- 持続可能性への懸念
- 促進要因
- 消費者の購買行動分析
- 人口動態の動向
- 購買決定に影響を与える要因
- 消費者の製品採用
- 好みの流通チャネル
- 成長可能性分析
- ポーター分析
- PESTEL分析
第4章 競合情勢
- イントロダクション
- 各社の市場シェア
- 主要市場プレーヤーの競合分析
- 競合のポジショニング・マトリックス
- 戦略展望マトリックス
第5章 市場推計・予測:タイプ別、2018年~2032年
- 主要動向
- 手動
- 自動
第6章 市場推計・予測:材料別、2018年~2032年、
- 主要動向
- 金属
- プラスチック
- その他(セラミックなど)
第7章 市場推計・予測:機能別、2018年~2032年
- 主要動向
- 流量制御
- シャットオフ
- その他(調節など)
第8章 市場推計・予測:最終用途別、2018年~2032年、
- 主要動向
- 化学
- 飲食品
- 医薬品
- 水処理
- 石油・ガス
- その他(鉱業など)
第9章 市場推計・予測:流通チャネル別、2018年~2032年
- 主要動向
- 直接
- 間接流通
第10章 市場推計・予測:地域別、2018年~2032年、
- 主要動向
- 北米
- 米国
- カナダ
- 欧州
- 英国
- ドイツ
- フランス
- イタリア
- スペイン
- アジア太平洋
- 中国
- インド
- 日本
- 韓国
- オーストラリア
- マレーシア
- インドネシア
- ラテンアメリカ
- ブラジル
- メキシコ
- 中東・アフリカ
- サウジアラビア
- UAE
- 南アフリカ
第11章 企業プロファイル
- Badger Meter
- Bürkert Fluid Control Systems
- ControlAir
- Crane
- Emerson Electric
- Festo
- Gore
- Graco
- Kitz Corporation
- Nordson Corporation
- Omega Engineering
- Parker Hannifin Corporation
- Pentair
- Schneider Electric
- Swagelok Company
The Global Pinch Tube Valve Market was valued at USD 608.8 million in 2024 and is projected to grow at a CAGR of 5% between 2025 and 2034. The increasing need for precise fluid control and hygienic automation across key industries such as pharmaceuticals, food and beverage, chemicals, and biotechnology is driving significant market expansion. These industries rely heavily on advanced fluid management solutions to enhance efficiency, maintain stringent hygiene standards, and meet regulatory compliance.
As automation becomes a cornerstone of industrial growth, demand for pinch tube valves continues to rise, ensuring contamination-free, efficient fluid handling. Additionally, technological advancements in valve design and materials are improving durability, performance, and adaptability, further fueling market penetration across various sectors. The growing focus on sustainability and energy efficiency is also prompting industries to adopt pinch tube valves, which offer minimal maintenance, reduced operational costs, and superior fluid control. With increasing investments in automation and process optimization, the market is poised for steady growth in the coming years.
| Market Scope | |
|---|---|
| Start Year | 2024 |
| Forecast Year | 2025-2034 |
| Start Value | $608.8 Million |
| Forecast Value | $990.9 Million |
| CAGR | 5% |
The pinch tube valve market is segmented based on operating type, primarily into manual and automatic valves. In 2024, manual pinch tube valves held the largest market share, reaching USD 364 million. Their widespread adoption is attributed to their simplicity, cost-effectiveness, and ease of maintenance. Small and medium-sized enterprises, as well as industries in the early stages of automation, prefer manual pinch valves for reliable fluid control without the complexity or cost of automated systems. These valves are widely used in applications where constant, high-volume automation is not a necessity, but precise fluid handling remains essential.
By material type, the pinch tube valve market is categorized into metal, plastic, and other materials. Metal valves dominated the market in 2024, accounting for a 70% share. Stainless steel, brass, and aluminum pinch valves are preferred for their superior durability, resistance to harsh operating conditions, and ability to withstand high pressure. Industries such as pharmaceuticals, chemical processing, and oil and gas opt for metal valves due to their reliability in extreme environments involving aggressive chemicals, elevated temperatures, and stringent safety requirements. The demand for corrosion-resistant and high-performance valve solutions continues to propel the adoption of metal pinch tube valves across industrial applications.
The U.S. pinch tube valve market was valued at USD 141.4 million in 2024, driven by the growing adoption of automation and process control technologies. Industries such as food processing, pharmaceuticals, and water treatment increasingly implement automated systems that require precise, contamination-free fluid flow control. Pinch tube valves play a critical role in ensuring operational efficiency, reliability, and compliance with hygiene standards in these sectors. As the need for accurate, maintenance-friendly, and durable valve solutions intensifies, the U.S. market is expected to witness consistent growth.
Table of Contents
Chapter 1 Methodology & Scope
- 1.1 Market scope & definition
- 1.2 Base estimates & calculations
- 1.3 Forecast calculations
- 1.4 Data sources
- 1.4.1 Primary
- 1.4.2 Secondary
- 1.4.2.1 Paid sources
- 1.4.2.2 Public sources
Chapter 2 Executive Summary
- 2.1 Industry 3600 synopsis, 2018 - 2032
Chapter 3 Industry Insights
- 3.1 Industry ecosystem analysis
- 3.1.1 Factor affecting the value chain
- 3.1.2 Profit margin analysis
- 3.1.3 Disruptions
- 3.1.4 Future outlook
- 3.1.5 Manufacturers
- 3.1.6 Distributors
- 3.2 Technology advancement analysis
- 3.3 Regulatory landscape
- 3.4 Impact forces
- 3.4.1 Growth drivers
- 3.4.1.1 Growing chemical market
- 3.4.1.2 Increasing demand for high performance applications
- 3.4.1.3 Expanding oil and gas market
- 3.4.2 Industry pitfalls & challenges
- 3.4.2.1 Market saturation
- 3.4.2.2 Sustainability concerns
- 3.4.1 Growth drivers
- 3.5 Consumer buying behavior analysis
- 3.5.1 Demographic trends
- 3.5.2 Factors affecting buying decision
- 3.5.3 Consumer product adoption
- 3.5.4 Preferred distribution channel
- 3.6 Growth potential analysis
- 3.7 Porter’s analysis
- 3.8 PESTEL analysis
Chapter 4 Competitive Landscape, 2023
- 4.1 Introduction
- 4.2 Company market share, 2023
- 4.3 Competitive analysis of major market players, 2023
- 4.4 Competitive positioning matrix, 2023
- 4.5 Strategic outlook matrix, 2023
Chapter 5 Market Estimates & Forecast, By Type, 2018 - 2032, (USD Million; Million Units)
- 5.1 Key trends
- 5.2 Manual
- 5.3 Automatic
Chapter 6 Market Estimates & Forecast, By Material, 2018 - 2032, (USD Million; Million Units)
- 6.1 Key trends
- 6.2 Metal
- 6.3 Plastic
- 6.4 Others (ceramic, etc.)
Chapter 7 Market Estimates & Forecast, By Function, 2018 - 2032, (USD Million; Million Units)
- 7.1 Key trends
- 7.2 Flow control
- 7.3 Shut-off
- 7.4 Other (regulation, etc.)
Chapter 8 Market Estimates & Forecast, By End Use, 2018 - 2032, (USD Million; Million Units)
- 8.1 Key trends
- 8.2 Chemical
- 8.3 Food and beverage
- 8.4 Pharmaceutical
- 8.5 Water treatment
- 8.6 Oil and gas
- 8.7 Others (mining, etc.)
Chapter 9 Market Estimates & Forecast, By Distribution Channel, 2018 - 2032, (USD Million; Million Units)
- 9.1 Key trends
- 9.2 Direct
- 9.3 Indirect
Chapter 10 Market Estimates & Forecast, By Region, 2018 - 2032, (USD Million; Million Units)
- 10.1 Key trends
- 10.2 North America
- 10.2.1 U.S.
- 10.2.2 Canada
- 10.3 Europe
- 10.3.1 UK
- 10.3.2 Germany
- 10.3.3 France
- 10.3.4 Italy
- 10.3.5 Spain
- 10.4 Asia Pacific
- 10.4.1 China
- 10.4.2 India
- 10.4.3 Japan
- 10.4.4 South Korea
- 10.4.5 Australia
- 10.4.6 Malaysia
- 10.4.7 Indonesia
- 10.5 Latin America
- 10.5.1 Brazil
- 10.5.2 Mexico
- 10.6 MEA
- 10.6.1 Saudi Arabia
- 10.6.2 UAE
- 10.6.3 South Africa
Chapter 11 Company Profiles
- 11.1 Badger Meter
- 11.2 Bürkert Fluid Control Systems
- 11.3 ControlAir
- 11.4 Crane
- 11.5 Emerson Electric
- 11.6 Festo
- 11.7 Gore
- 11.8 Graco
- 11.9 Kitz Corporation
- 11.10 Nordson Corporation
- 11.11 Omega Engineering
- 11.12 Parker Hannifin Corporation
- 11.13 Pentair
- 11.14 Schneider Electric
- 11.15 Swagelok Company

