
熱ストレスモニター市場のビジネスチャンス、成長要因、業界動向分析、および2026年~2035年の予測
Heat Stress Monitor Market Opportunity, Growth Drivers, Industry Trend Analysis, and Forecast 2026 - 2035- 発行日
- ページ情報
- 英文 180 Pages
- 納期
- 2~3営業日
- 商品コード
- 2038402
- カスタマイズ可能 お客様のご希望に応じて、既存データの加工や未掲載情報(例:国別セグメント)の追加などの対応が可能です。詳細はお問い合わせください。
- 翻訳ツール提供対象 PDF対応AI翻訳ツールの無料貸し出しサービスのご利用が可能です
世界の熱ストレスモニター市場は、2025年に7,020万米ドルと評価され、CAGR 7.8%で成長し、2035年までに1億4,800万米ドルに達すると予測されています。
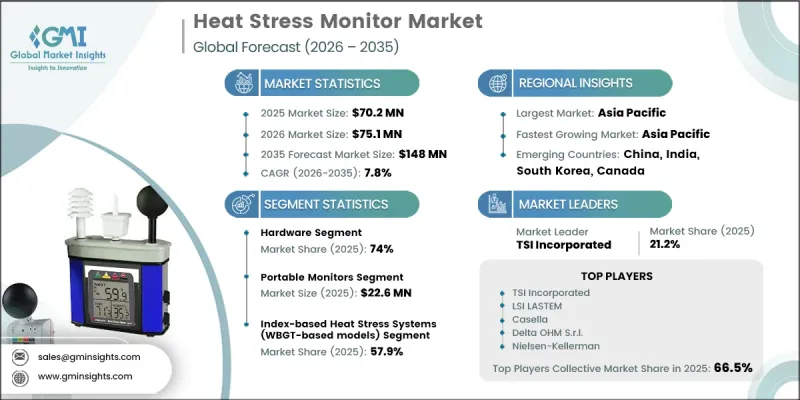
この市場の拡大は、各産業における労働者の熱安全規制の強化や、建設・鉱業現場でのWBGT(湿球黒球温度)ベースのモニタリングソリューションの導入拡大によるものです。主要な工業地域における極端な高温状態の頻発は、リアルタイムモニタリングシステムへの需要をさらに高めています。ウェアラブルデバイスやIoT対応デバイスの普及が進むことで、環境および生理状態の継続的な追跡が可能となり、職場の安全対策のあり方が変化しています。また、熱ストレスモニタリングソリューションが防衛活動や労働者の安全プログラムに統合されることも、市場浸透を後押ししています。気候変動の激化により、労働者は長時間の熱曝露リスクにさらされており、組織は高度な緩和策の導入を迫られています。さらに、製造および建設セクター全体での熱中症予防イニシアチブの実施拡大が、製品の採用を加速させています。リアルタイムセンシング技術の継続的な進歩と、携帯型および接続型モニタリングシステムの組み合わせにより、業務効率が向上し、産業用途全体での市場リーチが拡大しています。
| 市場範囲 | |
|---|---|
| 開始年 | 2025年 |
| 予測期間 | 2026年~2035年 |
| 開始時の市場規模 | 7,020万米ドル |
| 予測額 | 1億4,800万米ドル |
| CAGR | 7.8% |
2025年には、ハードウェアセグメントが市場シェアの74%を占めました。産業現場において正確なリアルタイムの環境データおよび生理データを収集する上で不可欠な役割を果たしているため、ハードウェアソリューションが熱ストレスモニター業界を牽引しています。WBGTメーター、ポータブルモニタリングシステム、ウェアラブルセンサーなどのデバイスは、安全基準の遵守や現場でのリスク管理のために広く利用されています。その精度、信頼性、および労働安全衛生体制へのシームレスな統合により、建設、鉱業、製造業の各環境において不可欠な存在となっています。
2025年、ポータブルモニターセグメントの市場規模は2,260万米ドルに達しました。建設、石油・ガス、鉱業などの現場作業における広範な利用が、強い需要を牽引しています。その機動性、迅速な展開能力、およびリアルタイムのデータ測定機能により、動的でリスクの高い環境に極めて適しています。これらのデバイスは、即時の安全判断を支援し、労働熱安全規制の順守を確保するため、屋外での産業用途において高い普及率を維持しています。
2025年、北米の熱ストレスモニター市場は28.1%のシェアを占めました。同地域の成長は、労働者の熱安全に焦点を当てた規制の強化や、建設、物流、製造業を含む各業界における熱中症関連疾患の増加によって支えられています。WBGT(湿球黒球温度)に基づくシステムやウェアラブルモニタリング技術の導入は、米国およびカナダ全土で着実に拡大しています。政府機関や民間組織は、労働者の安全を強化し、熱リスク管理の実践を改善するために、IoT対応のモニタリングプラットフォームやリアルタイム分析ソリューションへの投資をますます増やしています。
よくあるご質問
目次
第1章 調査手法と範囲
第2章 エグゼクティブサマリー
第3章 業界考察
- エコシステム分析
- サプライヤーの情勢
- 利益率
- コスト構造
- 各段階における付加価値
- バリューチェーンに影響を与える要因
- ディスラプション
- 業界への影響要因
- 促進要因
- OSHAの熱安全規制策定により、職場におけるコンプライアンス需要が加速しています
- 建設および鉱業分野におけるWBGTモニタリングの導入拡大
- 米国およびインドの工業地帯における熱波の頻度の増加
- 兵士の熱ストレスモニタリングシステムに対する防衛セクターの投資
- IoT対応ウェアラブル熱ストレスモニターの統合
- 業界の潜在的リスク&課題
- 高精度なWBGT測定装置の校正コストの高さ
- ウェアラブル生理センサーにおけるデータ精度の問題
- 市場機会
- AIを活用した熱ストレス予測分析の統合
- 物流・倉庫業界におけるスマートPPEの導入
- 促進要因
- 成長可能性分析
- 規制情勢
- ポーター分析
- PESTEL分析
- 技術およびイノベーションの動向
- 現在の技術動向
- 新興技術
- 価格動向
- 地域別
- 製品別
- 価格戦略
- 新興ビジネスモデル
- コンプライアンス要件
- 特許および知的財産分析
第4章 競合情勢
- イントロダクション
- 企業の市場シェア分析
- 地域別
- 市場集中度の分析
- 主要企業の競合ベンチマーキング
- 財務実績の比較
- 売上高
- 利益率
- 研究開発(R&D)
- 製品ポートフォリオの比較
- 製品ラインの幅
- 技術
- イノベーション
- 地域展開の比較
- 世界展開の分析
- サービスネットワークのカバー範囲
- 地域別市場浸透率
- 競合ポジショニングマトリックス
- リーダー
- チャレンジャー
- フォロワー
- ニッチプレイヤー
- 戦略的展望マトリックス
- 財務実績の比較
- 主な発展
- 合併・買収
- パートナーシップおよび提携
- 技術的進歩
- 事業拡大および投資戦略
- デジタルトランスフォーメーションの取り組み
- 新興/スタートアップ競合企業の動向
第5章 市場推計・予測:提供別、2022-2035
- ハードウェア
- ソフトウェアおよび分析
- サービス
第6章 市場推計・予測:製品タイプ別、2022-2035
- 据え置き型/エリアモニター
- ポータブルモニター
- ウェアラブルモニター
第7章 市場推計・予測:技術別、2022-2035
- 環境熱ストレスモニターシステム
- 生理学的熱負荷モニタリングシステム
- 指標ベースの熱ストレスシステム(WBGTベースのモデル)
第8章 市場推計・予測:用途別、2022-2035
- 製造業
- 建設
- 石油・ガス
- エネルギー・公益事業
- 鉱業
- 農業
- 軍事・防衛
- スポーツ・陸上競技
- 医療・研究
第9章 市場推計・予測:地域別、2022-2035
- 北米
- 米国
- カナダ
- 欧州
- ドイツ
- 英国
- フランス
- スペイン
- イタリア
- アジア太平洋地域
- 中国
- インド
- 日本
- オーストラリア
- 韓国
- ラテンアメリカ
- ブラジル
- メキシコ
- アルゼンチン
- 中東・アフリカ
- 南アフリカ
- サウジアラビア
- アラブ首長国連邦
第10章 企業プロファイル
- 世界の主要企業
- TSI Incorporated
- Delta OHM S.r.l.
- LSI LASTEM
- Casella
- 地域別主要企業
- 北米
- Nielsen-Kellerman
- REED Instruments
- Sper Scientific
- General Tools & Instruments
- アジア太平洋地域
- AZ Instrument Corp.
- TES Electrical Electronic Corp.
- Tenmars Electronics
- Sato Keiryoki Mfg. Co., Ltd.
- Kyoto Electronics Manufacturing
- Lutron Electronic Enterprise
- 欧州
- PCE Instruments
- 北米
- ニッチプレイヤー/ディスラプター
- Romteck Australia
- 発行日
- 発行
- Global Market Insights Inc.
- ページ情報
- 英文 180 Pages
- 納期
- 2~3営業日