
|
市場調査レポート
商品コード
1684808
貿易金融市場の機会、成長促進要因、産業動向分析、2025年~2034年の予測Trade Finance Market Opportunity, Growth Drivers, Industry Trend Analysis, and Forecast 2025 - 2034 |
||||||
カスタマイズ可能
|
|||||||
| 貿易金融市場の機会、成長促進要因、産業動向分析、2025年~2034年の予測 |
|
出版日: 2025年01月08日
発行: Global Market Insights Inc.
ページ情報: 英文 150 Pages
納期: 2~3営業日
|

全表示
- 概要
- 目次
世界の貿易金融市場は2024年に9兆7,000億米ドルと評価され、2025年から2034年にかけてCAGR 3.1%で成長すると予測されています。
国境を越えた取引をサポートするために必要な金融商品を提供することで国際貿易を促進する貿易金融は、変革期を迎えています。企業が世界に事業を拡大し続ける中、効率的で安全かつ透明性の高い資金調達ソリューションへの需要が高まっています。デジタル・プラットフォームとブロックチェーン技術の統合の進展が、この進化を後押ししています。かつて仲介業者に依存していた従来のプロセスを自動化することで、これらのテクノロジーは国際貿易に携わる企業の効率を大幅に改善し、コストを削減しています。さらに、ブロックチェーンの分散型台帳は高水準のセキュリティと透明性を保証し、国境を越えた取引における詐欺や紛争などのリスクを軽減する効果的なソリューションを提供しています。
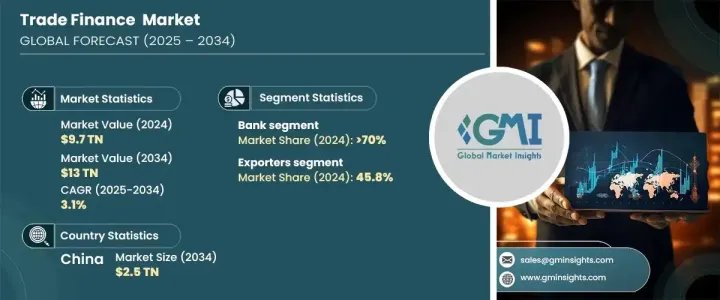
金融機関や企業が業務の合理化を目指す中、市場は大きな変化を経験しています。デジタル化へのシフトに伴い、市場参入企業はより迅速かつ事務的な作業を減らして取引を完了できるようになり、処理時間の短縮につながっています。デジタル貿易金融プラットフォームは、ブロックチェーンと組み合わせることで、透明性、効率性、安全性を高める新たな方法を提供します。このため、2024年の市場シェアで70%を占める銀行を中心に、こうした技術の普及が進んでいます。金融機関が先進技術を採用し続けることで、金融機関は貿易金融の分野で支配的な地位を維持し、市場全体の機能を向上させています。
| 市場範囲 | |
|---|---|
| 開始年 | 2024 |
| 予測年 | 2025-2034 |
| 開始金額 | 9兆7,000億米ドル |
| 予測金額 | 13兆ドル |
| CAGR | 3.1% |
貿易金融市場は最終用途の観点から、主に輸入業者、貿易業者、輸出業者に分類されます。輸出業者セグメントは2024年の市場シェアの45.8%を占めています。国際貿易が拡大し続ける中、輸出業者は支払遅延、為替変動、政情不安などの課題に対処するため、貿易金融ソリューションを利用する傾向が強まっています。迅速、安全、効率的な資金調達オプションへのニーズが、デジタル化された貿易金融ソリューションへの需要を押し上げています。ブロックチェーンを含むデジタル技術が取引の安全性と透明性を高めることで、輸出業者は金融取引の改善を実感しており、それが市場全体の成長を後押ししています。
特定の地域を見ると、中国の貿易金融市場は2034年までに2兆5,000億米ドルに達すると予想されています。この成長を後押ししているのは、インドや東南アジアなどの新興市場における貿易量の増加です。デジタル・プラットフォームやフィンテック・ソリューションの台頭により、貿易取引はよりスムーズかつ迅速になっており、企業は新たな機会を活用できるようになっています。地域包括的経済連携(RCEP)のような政府のイニシアティブも、中小企業(SMEs)の貿易金融へのアクセス拡大、国境を越えた貿易の促進、市場成長の刺激に重要な役割を果たしています。
目次
第1章 調査手法と調査範囲
- 調査デザイン
- 調査アプローチ
- データ収集方法
- 基本推定と計算
- 基準年の算出
- 市場推計の主要動向
- 予測モデル
- 1次調査と検証
- 一次情報
- データマイニングソース
- 市場定義
第2章 エグゼクティブサマリー
第3章 業界洞察
- エコシステム分析
- サプライヤーの状況
- 金融機関
- テクノロジー・プロバイダー
- 法律・規制機関
- エンドユーザー
- 利益率分析
- ケーススタディ
- 特許分析
- テクノロジーとイノベーションの展望
- 主要ニュースとイニシアチブ
- 規制状況
- 影響要因
- 促進要因
- 世界市場の相互接続性の高まり
- デジタル・プラットフォームとブロックチェーン技術の採用
- サプライチェーンの回復力への注目の高まり
- 規制の監視とコンプライアンス要件の増加
- 業界の潜在的リスク&課題
- 信用リスクとカウンターパーティ・リスク
- 普遍的基準の欠如
- 促進要因
- 成長可能性分析
- ポーター分析
- PESTEL分析
第4章 競合情勢
- イントロダクション
- 企業シェア分析
- 競合のポジショニング・マトリックス
- 戦略展望マトリックス
第5章 市場推計・予測:製品別、2021年~2034年
- 主要動向
- 商業信用状(LC)
- スタンドバイ信用状(LC)
- 保証状
- その他
第6章 市場推計・予測:プロバイダー別、2021年~2034年
- 主要動向
- 銀行
- 貿易金融会社
- 保険会社
- その他
第7章 市場推計・予測:用途別、2021年~2034年
- 主要動向
- 国内
- 海外
第8章 市場推計・予測:最終用途別、2021年~2034年
- 主要動向
- 貿易業者
- 輸入業者
- 輸出業者
第9章 市場推計・予測:業界別、2021年~2034年
- 主要動向
- 農業
- エネルギーとコモディティ
- 製造業
- 医薬品
- 消費財
- 自動車
第10章 市場推計・予測:地域別、2021年~2034年
- 主要動向
- 北米
- 米国
- カナダ
- 欧州
- 英国
- ドイツ
- フランス
- スペイン
- イタリア
- ロシア
- 北欧
- アジア太平洋
- 中国
- インド
- 日本
- 韓国
- ニュージーランド
- 東南アジア
- ラテンアメリカ
- ブラジル
- メキシコ
- アルゼンチン
- 中東・アフリカ
- UAE
- 南アフリカ
- サウジアラビア
第11章 企業プロファイル
- Bank of America
- Barclays
- BNP Paribas
- China Export &Credit Insurance(Sinosure)
- Citi
- Commerzbank
- Deutsche Bank
- Euler Hermes
- Exim Bank
- HSBC
- ING Group
- JPMorgan Chase
- Macquarie Group
- Mizuho Bank
- Rabobank
- Royal Bank of Canada(RBC)
- Societe Generale
- Standard Chartered
- UBS
- Wells Fargo
The Global Trade Finance Market was valued at USD 9.7 trillion in 2024 and is projected to grow at a CAGR of 3.1% from 2025 to 2034. Trade finance, which facilitates international trade by providing the necessary financial products to support cross-border transactions, is undergoing a transformation. As businesses continue to expand their operations globally, the demand for efficient, secure, and transparent financing solutions is on the rise. The increasing integration of digital platforms and blockchain technology is driving this evolution. By automating traditional processes that once relied on intermediaries, these technologies are significantly improving efficiency and cutting costs for businesses involved in international trade. Moreover, blockchain's decentralized ledger ensures a high level of security and transparency, offering an effective solution for mitigating risks such as fraud and disputes in cross-border transactions.
The market is experiencing significant changes as financial institutions and companies look to streamline their operations. With the shift towards digitization, market participants can now complete transactions more quickly and with reduced paperwork, leading to faster processing times. Digital trade finance platforms, combined with blockchain, offer new ways to enhance transparency, efficiency, and security. This is driving the widespread adoption of these technologies, especially among banks, which held a 70% market share in 2024. As financial institutions continue to embrace advanced technologies, they are maintaining a dominant position in the trade finance space, improving the overall functioning of the market.
| Market Scope | |
|---|---|
| Start Year | 2024 |
| Forecast Year | 2025-2034 |
| Start Value | $9.7 Trillion |
| Forecast Value | $13 Trillion |
| CAGR | 3.1% |
In terms of end-use, the trade finance market is mainly categorized into importers, traders, and exporters. The exporters' segment accounted for 45.8% of the market share in 2024. As international trade continues to grow, exporters are increasingly turning to trade finance solutions to address challenges like delayed payments, currency fluctuations, and political instability. The need for fast, secure, and efficient financing options is pushing the demand for digitized trade finance solutions. With digital technologies, including blockchain, enhancing the security and transparency of transactions, exporters are experiencing improved financial transactions, which in turn, is fueling the overall growth of the market.
Looking at specific regions, the China trade finance market is expected to reach USD 2.5 trillion by 2034. This growth is being fueled by increasing trade volumes in emerging markets like India and Southeast Asia. With the rise of digital platforms and fintech solutions, trade transactions are becoming smoother and faster, allowing businesses to take advantage of new opportunities. Government initiatives, such as the Regional Comprehensive Economic Partnership (RCEP), are also playing a key role in expanding access to trade finance for small and medium-sized enterprises (SMEs), promoting cross-border trade, and stimulating market growth.
Table of Contents
Chapter 1 Methodology & Scope
- 1.1 Research design
- 1.1.1 Research approach
- 1.1.2 Data collection methods
- 1.2 Base estimates and calculations
- 1.2.1 Base year calculation
- 1.2.2 Key trends for market estimates
- 1.3 Forecast model
- 1.4 Primary research & validation
- 1.4.1 Primary sources
- 1.4.2 Data mining sources
- 1.5 Market definitions
Chapter 2 Executive Summary
- 2.1 Industry 3600 synopsis, 2021 - 2034
Chapter 3 Industry Insights
- 3.1 Industry ecosystem analysis
- 3.2 Supplier landscape
- 3.2.1 Financial institutions
- 3.2.2 Technology providers
- 3.2.3 Legal and regulatory bodies
- 3.2.4 End users
- 3.3 Profit margin analysis
- 3.4 Case studies
- 3.5 Patent analysis
- 3.6 Technology & innovation landscape
- 3.7 Key news & initiatives
- 3.8 Regulatory landscape
- 3.9 Impact forces
- 3.9.1 Growth drivers
- 3.9.1.1 Increasing interconnectivity of global markets
- 3.9.1.2 Adoption of digital platforms and blockchain technology
- 3.9.1.3 Increasing focus on supply chain resilience
- 3.9.1.4 Increasing regulatory scrutiny and compliance requirements
- 3.9.2 Industry pitfalls & challenges
- 3.9.2.1 Credit risk and counterparty risk
- 3.9.2.2 Lack of universal standards
- 3.9.1 Growth drivers
- 3.10 Growth potential analysis
- 3.11 Porter’s analysis
- 3.12 PESTEL analysis
Chapter 4 Competitive Landscape, 2024
- 4.1 Introduction
- 4.2 Company market share analysis
- 4.3 Competitive positioning matrix
- 4.4 Strategic outlook matrix
Chapter 5 Market Estimates & Forecast, By Product, 2021 - 2034 ($Bn)
- 5.1 Key trends
- 5.2 Commercial Letters of Credit (LCs)
- 5.3 Standby Letters of Credit (LCs)
- 5.4 Guarantees
- 5.5 Others
Chapter 6 Market Estimates & Forecast, By Provider, 2021 - 2034 ($Bn)
- 6.1 Key trends
- 6.2 Banks
- 6.3 Trade finance houses
- 6.4 Insurance companies
- 6.5 Others
Chapter 7 Market Estimates & Forecast, By Application, 2021 - 2034 ($Bn)
- 7.1 Key trends
- 7.2 Domestic
- 7.3 International
Chapter 8 Market Estimates & Forecast, By End Use, 2021 - 2034 ($Bn)
- 8.1 Key trends
- 8.2 Traders
- 8.3 Importers
- 8.4 Exporters
Chapter 9 Market Estimates & Forecast, By Vertical, 2021 - 2034 ($Bn)
- 9.1 Key trends
- 9.2 Agriculture
- 9.3 Energy and Commodities
- 9.4 Manufacturing
- 9.5 Pharmaceuticals
- 9.6 Consumer Goods
- 9.7 Automotive
Chapter 10 Market Estimates & Forecast, By Region, 2021 - 2034 ($Bn)
- 10.1 Key trends
- 10.2 North America
- 10.2.1 U.S.
- 10.2.2 Canada
- 10.3 Europe
- 10.3.1 UK
- 10.3.2 Germany
- 10.3.3 France
- 10.3.4 Spain
- 10.3.5 Italy
- 10.3.6 Russia
- 10.3.7 Nordics
- 10.4 Asia Pacific
- 10.4.1 China
- 10.4.2 India
- 10.4.3 Japan
- 10.4.4 South Korea
- 10.4.5 ANZ
- 10.4.6 Southeast Asia
- 10.5 Latin America
- 10.5.1 Brazil
- 10.5.2 Mexico
- 10.5.3 Argentina
- 10.6 MEA
- 10.6.1 UAE
- 10.6.2 South Africa
- 10.6.3 Saudi Arabia
Chapter 11 Company Profiles
- 11.1 Bank of America
- 11.2 Barclays
- 11.3 BNP Paribas
- 11.4 China Export & Credit Insurance (Sinosure)
- 11.5 Citi
- 11.6 Commerzbank
- 11.7 Deutsche Bank
- 11.8 Euler Hermes
- 11.9 Exim Bank
- 11.10 HSBC
- 11.11 ING Group
- 11.12 JPMorgan Chase
- 11.13 Macquarie Group
- 11.14 Mizuho Bank
- 11.15 Rabobank
- 11.16 Royal Bank of Canada (RBC)
- 11.17 Societe Generale
- 11.18 Standard Chartered
- 11.19 UBS
- 11.20 Wells Fargo
