
|
市場調査レポート
商品コード
1766290
マイクロインバータの市場機会と促進要因、産業動向分析、2025年~2034年予測Microinverter Market Opportunity, Growth Drivers, Industry Trend Analysis, and Forecast 2025 - 2034 |
||||||
カスタマイズ可能
|
|||||||
| マイクロインバータの市場機会と促進要因、産業動向分析、2025年~2034年予測 |
|
出版日: 2025年06月10日
発行: Global Market Insights Inc.
ページ情報: 英文 123 Pages
納期: 2~3営業日
|

全表示
- 概要
- 目次
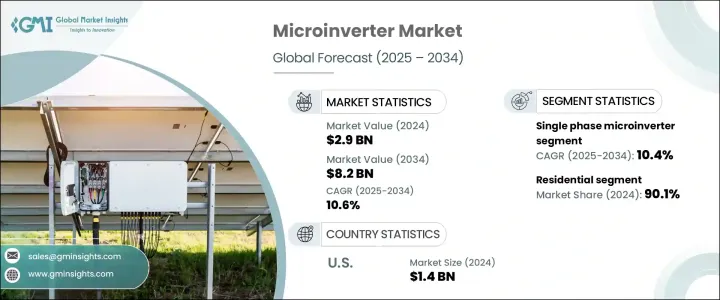
マイクロインバータの世界市場規模は、2024年に29億米ドルとなり、CAGR 10.6%で成長し、2034年には82億米ドルに達すると予測されています。
プラグアンドプレイソーラーシステムの人気の高まりが市場拡大に大きく寄与しています。これらのシステムは設置が簡単で、メンテナンスがほとんど必要なく、柔軟性が高いため、住宅ユーザーやDIYソーラー愛好家にとって非常に魅力的です。より多くの消費者が合理的なソーラーセットアップを好むようになり、組み込み型マイクロインバータ技術への需要は高まり続けています。停電が発生しやすい地域で、回復力のあるエネルギー・ソリューションと迅速な電力復旧の必要性が高まっていることが、マイクロインバータの採用をさらに後押ししています。停電時にシステムを部分的に稼動させ続けるその能力は、グリッド全体の信頼性を高める。スマート分散型エネルギーシステムへのシフトも、マイクロインバータの普及を後押ししています。
安全性、効率性、リアルタイムの太陽エネルギー管理への注目が高まるにつれ、モジュールレベルのパワーエレクトロニクスの統合が加速しています。マイクロインバータは、リアルタイムのシステム診断、高速シャットダウン機能、高いエネルギー収率を提供することで、この動向を支えています。規制の安全基準が進化し続ける中、これらの利点は特に不可欠です。住宅用太陽光発電分野の持続的な勢いは、マイクロインバータソリューションの市場浸透と長期的な成長見通しを促進する上で極めて重要な役割を果たしています。
| 市場範囲 | |
|---|---|
| 開始年 | 2024 |
| 予測年 | 2025-2034 |
| 開始金額 | 29億米ドル |
| 予測金額 | 82億米ドル |
| CAGR | 10.6% |
マイクロインバータ市場の三相セグメントは、2034年までに8億米ドルを生み出すと予測されています。この成長の原動力となっているのは、商業用および産業用太陽光発電の導入が拡大し、三相すべてでより大きな電力処理と信頼性の高いエネルギー配分が求められていることです。大規模な太陽光発電プロジェクトへの投資の増加と、バランスの取れた負荷配分や高度なグリッド互換性への注目の高まりが、三相システムの採用を後押しすると予想されます。また、故障検出の強化やグリッドの通信技術のスマート化も、産業用アプリケーションにおける同分野の訴求力を高めると思われます。
2024年には、住宅セグメントが90.1%のシェアを占める。高効率でユーザーフレンドリーな家庭用太陽エネルギー・ソリューションに対する需要の急増が、この優位性の核心です。住宅所有者がシステムの簡素化と安全性を優先する中、マイクロインバータは住宅用太陽光発電設備に不可欠なものとなりつつあります。メンテナンスの必要性が最小限に抑えられ、性能も向上していることから、マイクロインバータはさらに好まれる選択肢となっています。
欧州マイクロインバータ2034年までのCAGRは12.4%と予想され、分散型太陽エネルギーインフラへの一貫した投資とカーボンニュートラルへの強い後押しが原動力となっています。送電網の近代化を支援する取り組みやネットメータリングなどの政策が、この地域全体のマイクロインバータ設置の成長を促進し続けています。特に住宅分野では、エネルギー自給への関心が高まっており、製品の採用と地域市場シェアの拡大が予測されます。
世界のマイクロインバータ産業の主要参入企業には、Yotta Energy、Growatt New Energy、SMA Solar Technology、APSystems、Darfon Electronics、Chisageess、Fimer Group、AEconversion、Envertech、Sugrow、Deye Inverter Technology、Shenzhen Sako Solar、LeadSolar Energy、Northern Electric Power Technology、Enphase Energy、TSUNESS、Chilicon Power、Hoymiles、Sparq System、NingBo Deye Inverter Technologyなどがあります。マイクロインバータ分野の主要企業は競争力を強化するため、研究開発に多額の投資を行い、小型で高効率のグリッド準拠インバーター技術を開発しています。メーカー各社は、進化する住宅や商業施設のニーズに対応するため、リアルタイム監視機能、高速シャットダウン機能、高出力処理機能を強化したマイクロインバータを展開しています。太陽電池パネルメーカーや施工業者との戦略的提携により、より幅広い流通と製品のバンドルが可能になります。市場企業はまた、屋上太陽光発電の導入が増加している新興地域にも進出しています。製造コストを削減し、サプライチェーンをよりよく管理するために、垂直統合に注力する企業もあります。
目次
第1章 調査手法と範囲
第2章 エグゼクティブサマリー
第3章 業界考察
- 業界エコシステム
- 規制情勢
- 業界への影響要因
- 促進要因
- 業界の潜在的リスク&課題
- 成長可能性分析
- ポーター分析
- PESTEL分析
第4章 競合情勢
- イントロダクション
- 企業の市場シェア
- 戦略的ダッシュボード
- 戦略的取り組み
- 競合ベンチマーキング
- イノベーションと持続可能性の情勢
第5章 市場規模・予測:フェーズ別、2021年~2034年
- 主要動向
- 単相
- 三相
第6章 市場規模・予測:接続性別、2021年~2034年
- 主要動向
- スタンドアロン
- グリッド上
第7章 市場規模・予測:用途別、2021年~2034年
- 主要動向
- 住宅用
- 商業用
第8章 市場規模・予測:地域別、2021年~2034年
- 主要動向
- 北米
- 米国
- カナダ
- 欧州
- ドイツ
- イタリア
- ポーランド
- オランダ
- オーストリア
- 英国
- フランス
- スペイン
- ベルギー
- アジア太平洋地域
- 中国
- 日本
- インド
- 韓国
- オーストラリア
- 中東・アフリカ
- イスラエル
- サウジアラビア
- アラブ首長国連邦
- 南アフリカ
- エジプト
- ナイジェリア
- ラテンアメリカ
- ブラジル
- チリ
- メキシコ
第9章 企業プロファイル
- AEconversion
- APSystems
- Chilicon Power
- Chisageess
- Darfon Electronics
- Deye Inverter Technology
- Dongguan Maywah
- Enphase Energy
- Fimer Group
- Growatt New Energy
- Hoymiles
- Envertech
- LeadSolar Energy
- NingBo Deye Inverter Technology
- Northern Electric Power Technology
- Sensata Technologies
- Shenzhen Sako Solar
- SMA Solar Technology
- Sparq System
- Sugrow
- TSUNESS
- Yotta Energy
The Global Microinverter Market was valued at USD 2.9 billion in 2024 and is estimated to grow at a CAGR of 10.6% to reach USD 8.2 billion by 2034. The rising popularity of plug-and-play solar systems is significantly contributing to market expansion. These systems are easy to install, require little maintenance, and offer more flexibility, making them highly attractive for residential users and DIY solar enthusiasts. As more consumers prefer streamlined solar setups, demand for embedded microinverter technology continues to rise. The increasing need for resilient energy solutions and fast power restoration in outage-prone areas further fuels the adoption of microinverters. Their ability to keep systems partially operational during faults enhances overall grid reliability. Shifts toward smart distributed energy systems also bolster their uptake.
The growing focus on safety, efficiency, and real-time solar energy management is accelerating the integration of module-level power electronics. Microinverters support this trend by offering real-time system diagnostics, faster shutdown capabilities, and higher energy yields. These benefits are particularly vital as regulatory safety standards continue to evolve. The sustained momentum in the residential photovoltaic sector plays a pivotal role in driving market penetration and long-term growth prospects for microinverter solutions.
| Market Scope | |
|---|---|
| Start Year | 2024 |
| Forecast Year | 2025-2034 |
| Start Value | $2.9 Billion |
| Forecast Value | $8.2 Billion |
| CAGR | 10.6% |
The three-phase segment in the microinverter market is forecasted to generate USD 800 million by 2034. This growth is driven by expanding commercial and industrial solar deployments that demand greater power handling and reliable energy distribution across all three phases. Rising investments in large-scale solar projects, coupled with an increasing focus on balanced load distribution and advanced grid compatibility, are expected to support the adoption of three-phase systems. Enhanced fault detection and smarter grid communication technologies will also boost the segment's appeal in industrial applications.
In 2024, the residential segment accounted for a 90.1% share. The surge in demand for highly efficient, user-friendly home solar energy solutions is at the heart of this dominance. As homeowners prioritize system simplicity and safety, microinverters are becoming an integral part of residential solar installations. Their minimal maintenance requirements and improved performance further position them as a preferred choice.
Europe Microinverter Market is expected to register a CAGR of 12.4% through 2034, driven by consistent investment in decentralized solar energy infrastructure and a strong push for carbon neutrality. Supportive grid modernization efforts and policies such as net metering continue to foster the growth of microinverter installations across the region. The increasing focus on energy independence, especially in residential sectors, is projected to enhance product adoption and regional market share.
Major participants in the Global Microinverter Industry include Yotta Energy, Growatt New Energy, SMA Solar Technology, APSystems, Darfon Electronics, Chisageess, Fimer Group, AEconversion, Envertech, Sugrow, Deye Inverter Technology, Shenzhen Sako Solar, LeadSolar Energy, Northern Electric Power Technology, Enphase Energy, TSUNESS, Chilicon Power, Hoymiles, Sparq System, and NingBo Deye Inverter Technology. To strengthen their competitive standing, leading companies in the microinverter space are investing heavily in R&D to develop compact, highly efficient, and grid-compliant inverter technologies. Manufacturers are rolling out microinverters with enhanced real-time monitoring, faster shutdown features, and higher power handling to meet evolving residential and commercial needs. Strategic alliances with solar panel producers and installation providers enable wider distribution and product bundling. Market players are also expanding into emerging regions where rooftop solar deployment is rising. Some focus on vertical integration to reduce manufacturing costs and gain better control over supply chains.
Table of Contents
Chapter 1 Methodology & Scope
- 1.1 Research design
- 1.2 Base estimates & calculations
- 1.3 Forecast calculation
- 1.4 Primary research & validation
- 1.4.1 Primary sources
- 1.4.2 Data mining sources
- 1.5 Market definitions
Chapter 2 Executive Summary
- 2.1 Industry synopsis, 2021 - 2034
Chapter 3 Industry Insights
- 3.1 Industry ecosystem
- 3.2 Regulatory landscape
- 3.3 Industry impact forces
- 3.3.1 Growth drivers
- 3.3.2 Industry pitfalls & challenges
- 3.4 Growth potential analysis
- 3.5 Porter's analysis
- 3.5.1 Bargaining power of suppliers
- 3.5.2 Bargaining power of buyers
- 3.5.3 Threat of new entrants
- 3.5.4 Threat of substitutes
- 3.6 PESTEL analysis
Chapter 4 Competitive landscape, 2024
- 4.1 Introduction
- 4.2 Company market share
- 4.3 Strategic dashboard
- 4.4 Strategic initiative
- 4.5 Competitive benchmarking
- 4.6 Innovation & sustainability landscape
Chapter 5 Market Size and Forecast, By Phase, 2021 - 2034 (USD Million & MW)
- 5.1 Key trends
- 5.2 Single phase
- 5.3 Three phase
Chapter 6 Market Size and Forecast, By Connectivity, 2021 - 2034 (USD Million & MW)
- 6.1 Key trends
- 6.2 Stand alone
- 6.3 On grid
Chapter 7 Market Size and Forecast, By Application, 2021 - 2034 (USD Million & MW)
- 7.1 Key trends
- 7.2 Residential
- 7.3 Commercial
Chapter 8 Market Size and Forecast, By Region, 2021 - 2034 (USD Million & MW)
- 8.1 Key trends
- 8.2 North America
- 8.2.1 U.S.
- 8.2.2 Canada
- 8.3 Europe
- 8.3.1 Germany
- 8.3.2 Italy
- 8.3.3 Poland
- 8.3.4 Netherlands
- 8.3.5 Austria
- 8.3.6 UK
- 8.3.7 France
- 8.3.8 Spain
- 8.3.9 Belgium
- 8.4 Asia Pacific
- 8.4.1 China
- 8.4.2 Japan
- 8.4.3 India
- 8.4.4 South Korea
- 8.4.5 Australia
- 8.5 Middle East & Africa
- 8.5.1 Israel
- 8.5.2 Saudi Arabia
- 8.5.3 UAE
- 8.5.4 South Africa
- 8.5.5 Egypt
- 8.5.6 Nigeria
- 8.6 Latin America
- 8.6.1 Brazil
- 8.6.2 Chile
- 8.6.3 Mexico
Chapter 9 Company Profiles
- 9.1 AEconversion
- 9.2 APSystems
- 9.3 Chilicon Power
- 9.4 Chisageess
- 9.5 Darfon Electronics
- 9.6 Deye Inverter Technology
- 9.7 Dongguan Maywah
- 9.8 Enphase Energy
- 9.9 Fimer Group
- 9.10 Growatt New Energy
- 9.11 Hoymiles
- 9.12 Envertech
- 9.13 LeadSolar Energy
- 9.14 NingBo Deye Inverter Technology
- 9.15 Northern Electric Power Technology
- 9.16 Sensata Technologies
- 9.17 Shenzhen Sako Solar
- 9.18 SMA Solar Technology
- 9.19 Sparq System
- 9.20 Sugrow
- 9.21 TSUNESS
- 9.22 Yotta Energy

