
|
市場調査レポート
商品コード
1684648
レーダーシミュレータ市場機会と成長促進要因、産業動向分析、2025年~2034年予測Radar Simulators Market Opportunity, Growth Drivers, Industry Trend Analysis, and Forecast 2025 - 2034 |
||||||
カスタマイズ可能
|
|||||||
| レーダーシミュレータ市場機会と成長促進要因、産業動向分析、2025年~2034年予測 |
|
出版日: 2025年01月10日
発行: Global Market Insights Inc.
ページ情報: 英文 180 Pages
納期: 2~3営業日
|

全表示
- 概要
- 目次
世界のレーダーシミュレータ市場は2024年に27億米ドルとなり、2025年から2034年にかけてCAGR 6.4%で拡大すると予測されています。
この成長の主な要因は、高度な防衛システムと最先端のミサイル技術に対する需要の高まりです。世界中の政府や防衛機関がレーダー・システムの精度、効率、運用能力を高めようとする中、レーダー・シミュレーターの採用は極めて重要になっています。これらのシミュレータはリアルタイムの仮想試験を可能にし、実地試験に伴うリスクを伴わずにさまざまな運用シナリオをシミュレートするのに役立っています。これと並行して、人工知能(AI)とエッジコンピューティングをレーダーシステムに統合することで、これらのシミュレーションがより賢く効率的になり、システム全体の性能が向上しています。これらの分野における技術進歩の組み合わせにより、レーダー・シミュレーターは防衛戦略と人材育成プログラムの近代化に不可欠なものとなっています。
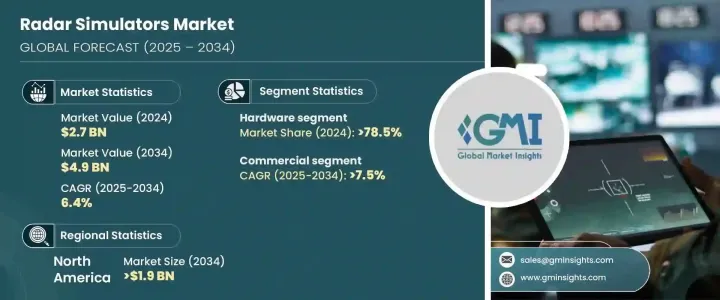
レーダーシミュレータ市場はハードウェアとソフトウェアコンポーネントに区分され、2024年にはハードウェアセグメントが78.5%の圧倒的シェアを占めます。このセグメントは、半導体技術の継続的な進歩に牽引され、急速なペースで成長し続けると予測されています。こうした技術革新により、高性能を維持しながら、より小型で携帯可能なレーダー・シミュレーターの製造が可能になります。この動向は、運用の柔軟性と有効性のためにコンパクトなモバイルシステムが必要な防衛や自動車などの分野で特に重要です。
| 市場範囲 | |
|---|---|
| 開始年 | 2024年 |
| 予測年 | 2025-2034年 |
| 開始金額 | 27億米ドル |
| 予測金額 | 49億米ドル |
| CAGR | 6.4% |
用途の観点から、市場は商業セグメントと軍事・防衛セグメントに分けられます。商業セグメントは、2034年までCAGR 7.5%という驚異的な成長を遂げます。この成長の主な原動力は、自動車産業、特にADAS(先進運転支援システム)のテスト用としてレーダーシミュレータの採用が増加していることです。自動車の自律化が進むにつれて、アダプティブ・クルーズ・コントロール、自動緊急ブレーキ、車線維持支援などのADAS機能は、そのテストと検証のためにレーダー・シミュレータ技術に大きく依存しています。このような自動車アプリケーションにおける需要の高まりは、商業セグメントの拡大を後押しする重要な要因となっています。
北米、特に米国はレーダーシミュレータ市場を独占する勢いであり、2034年までに19億米ドルの市場価値が予測されています。この地域では、防衛、自動車、通信分野でレーダーシミュレーション技術が急速に採用されていることが、この成長の主な要因となっています。また、AIや機械学習の革新により、特に自律走行試験や次世代防衛システムなどの分野でレーダーシミュレータの機能が強化されています。
目次
第1章 調査手法と調査範囲
- 市場範囲と定義
- 基本推定と計算
- 予測計算
- データソース
- 1次データ
- 二次資料
- 有料情報源
- 公的情報源
第2章 エグゼクティブサマリー
第3章 業界洞察
- エコシステム分析
- バリューチェーンに影響を与える要因
- 利益率分析
- 破壊
- 将来の展望
- メーカー
- 流通業者
- サプライヤーの状況
- 利益率分析
- 主要ニュース
- 規制状況
- 影響要因
- 促進要因
- 自律走行技術への需要の高まり
- 防衛・軍事の近代化
- AIと機械学習の統合
- 5Gネットワークの展開とレーダーベースの通信技術の進歩
- ADAS(先進運転支援システム)の需要増加
- 業界の潜在的リスク&課題
- 高い開発コスト
- シミュレーション精度の複雑さ
- 促進要因
- 成長可能性分析
- ポーター分析
- PESTEL分析
第4章 競合情勢
- イントロダクション
- 企業シェア分析
- 競合のポジショニング・マトリックス
- 戦略展望マトリックス
第5章 市場推計・予測:製品別、2021年~2034年
- 主要動向
- システムテスト
- 固定型
- ポータブル
- オペレータートレーニング
- 固定式
- ポータブル
第6章 市場推計・予測:コンポーネント別、2021年~2034年
- 主要動向
- ハードウェア
- ソフトウェア
第7章 用途別市場推計・予測:用途別、2021年~2034年
- 主要動向
- 商業
- 軍事・防衛
- 航空機
- 海上
- 地上
第8章 市場推計・予測:地域別、2021~2034年
- 主要動向
- 北米
- 米国
- カナダ
- 欧州
- 英国
- ドイツ
- フランス
- イタリア
- スペイン
- ロシア
- アジア太平洋
- 中国
- インド
- 日本
- 韓国
- オーストラリア
- ラテンアメリカ
- ブラジル
- メキシコ
- 中東・アフリカ
- 南アフリカ
- サウジアラビア
- アラブ首長国連邦
第9章 企業プロファイル
- Acewavetech
- Adacel Technologies
- ARI Simulation
- Buffalo Computer Graphics
- Cambridge Pixel
- L3Harris Technologies
- Mercury Systems
- Mistral Solutions
- RTX
- Textron Systems
- Ultra Intelligence &Communications
The Global Radar Simulators Market was valued at USD 2.7 billion in 2024 and is forecasted to expand at a CAGR of 6.4% from 2025 to 2034. This growth is primarily driven by the escalating demand for advanced defense systems and cutting-edge missile technology. As governments and defense organizations around the world seek to enhance the accuracy, efficiency, and operational capabilities of their radar systems, the adoption of radar simulators has become crucial. These simulators allow for real-time virtual testing, helping to simulate various operational scenarios without the risks associated with live trials. Alongside this, the integration of artificial intelligence (AI) and edge computing into radar systems is making these simulations smarter and more efficient, improving overall system performance. The combination of technological advancements in these areas ensures that radar simulators are essential for modernizing both defense strategies and personnel training programs.
The radar simulators market is segmented into hardware and software components, with the hardware segment holding a dominant share of 78.5% in 2024. This segment is projected to continue growing at a rapid pace, driven by ongoing advancements in semiconductor technology. These innovations enable the production of smaller, more portable radar simulators that still deliver high-performance capabilities. This trend is especially critical in sectors like defense and automotive, where compact, mobile systems are necessary for operational flexibility and effectiveness.
| Market Scope | |
|---|---|
| Start Year | 2024 |
| Forecast Year | 2025-2034 |
| Start Value | $2.7 Billion |
| Forecast Value | $4.9 Billion |
| CAGR | 6.4% |
In terms of application, the market is divided into commercial and military & defense segments. The commercial segment is set to grow at an impressive CAGR of 7.5% through 2034. A major driver of this growth is the increasing adoption of radar simulators in the automotive industry, particularly for testing advanced driver-assistance systems (ADAS). As vehicles become more autonomous, ADAS features such as adaptive cruise control, automatic emergency braking, and lane-keeping assistance rely heavily on radar simulator technologies for their testing and validation. This growing demand in automotive applications is a significant factor pushing the commercial segment's expansion.
North America, particularly the United States, is poised to dominate the radar simulators market, with a projected market value of USD 1.9 billion by 2034. The region's rapid adoption of radar simulation technologies in defense, automotive, and telecommunications sectors is a key factor in this growth. Additionally, innovations in AI and machine learning are enhancing radar simulators' capabilities, especially in areas like autonomous vehicle testing and next-generation defense systems.
Table of Contents
Chapter 1 Methodology & Scope
- 1.1 Market scope & definitions
- 1.2 Base estimates & calculations
- 1.3 Forecast calculations
- 1.4 Data sources
- 1.4.1 Primary
- 1.4.2 Secondary
- 1.4.2.1 Paid sources
- 1.4.2.2 Public sources
Chapter 2 Executive Summary
- 2.1 Industry synopsis, 2021-2034
Chapter 3 Industry Insights
- 3.1 Industry ecosystem analysis
- 3.1.1 Factor affecting the value chain
- 3.1.2 Profit margin analysis
- 3.1.3 Disruptions
- 3.1.4 Future outlook
- 3.1.5 Manufacturers
- 3.1.6 Distributors
- 3.2 Supplier landscape
- 3.3 Profit margin analysis
- 3.4 Key news & initiatives
- 3.5 Regulatory landscape
- 3.6 Impact forces
- 3.6.1 Growth drivers
- 3.6.1.1 Increasing demand for autonomous driving technologies
- 3.6.1.2 Defense and military modernization
- 3.6.1.3 Integration of AI and machine learning
- 3.6.1.4 Rollout of 5G networks and advancements in radar-based communication technologies
- 3.6.1.5 Rising demand for Advanced Driver Assistance Systems (ADAS)
- 3.6.2 Industry pitfalls & challenges
- 3.6.2.1 High development costs
- 3.6.2.2 Complexity in simulation accuracy
- 3.6.1 Growth drivers
- 3.7 Growth potential analysis
- 3.8 Porter's analysis
- 3.9 PESTEL analysis
Chapter 4 Competitive Landscape, 2024
- 4.1 Introduction
- 4.2 Company market share analysis
- 4.3 Competitive positioning matrix
- 4.4 Strategic outlook matrix
Chapter 5 Market Estimates & Forecast, By Product, 2021-2034 (USD Million)
- 5.1 Key trends
- 5.2 System testing
- 5.2.1 Fixed
- 5.2.2 Portable
- 5.3 Operator training
- 5.3.1 Fixed
- 5.3.2 Portable
Chapter 6 Market Estimates & Forecast, By Component, 2021-2034 (USD Million)
- 6.1 Key trends
- 6.2 Hardware
- 6.3 Software
Chapter 7 Market Estimates & Forecast, By Application, 2021-2034 (USD Million)
- 7.1 Key trends
- 7.2 Commercial
- 7.3 Military & defense
- 7.3.1 Airborne
- 7.3.2 Marine
- 7.3.3 Ground
Chapter 8 Market Estimates & Forecast, By Region, 2021-2034 (USD Million)
- 8.1 Key trends
- 8.2 North America
- 8.2.1 U.S.
- 8.2.2 Canada
- 8.3 Europe
- 8.3.1 UK
- 8.3.2 Germany
- 8.3.3 France
- 8.3.4 Italy
- 8.3.5 Spain
- 8.3.6 Russia
- 8.4 Asia Pacific
- 8.4.1 China
- 8.4.2 India
- 8.4.3 Japan
- 8.4.4 South Korea
- 8.4.5 Australia
- 8.5 Latin America
- 8.5.1 Brazil
- 8.5.2 Mexico
- 8.6 MEA
- 8.6.1 South Africa
- 8.6.2 Saudi Arabia
- 8.6.3 UAE
Chapter 9 Company Profiles
- 9.1 Acewavetech
- 9.2 Adacel Technologies
- 9.3 ARI Simulation
- 9.4 Buffalo Computer Graphics
- 9.5 Cambridge Pixel
- 9.6 L3Harris Technologies
- 9.7 Mercury Systems
- 9.8 Mistral Solutions
- 9.9 RTX
- 9.10 Textron Systems
- 9.11 Ultra Intelligence & Communications
