
|
市場調査レポート
商品コード
1666982
オゾン発生器市場の機会、成長促進要因、産業動向分析、2025年~2034年の予測Ozone Generator Market Opportunity, Growth Drivers, Industry Trend Analysis, and Forecast 2025 - 2034 |
||||||
カスタマイズ可能
|
|||||||
| オゾン発生器市場の機会、成長促進要因、産業動向分析、2025年~2034年の予測 |
|
出版日: 2024年12月02日
発行: Global Market Insights Inc.
ページ情報: 英文 80 Pages
納期: 2~3営業日
|

全表示
- 概要
- 目次
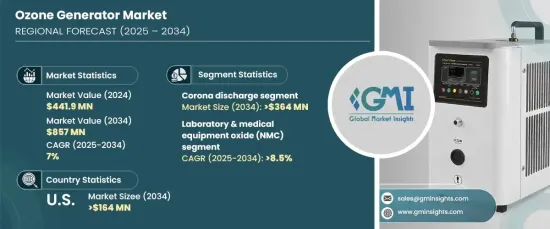
オゾン発生器の世界市場は、2024年には4億4,190万米ドルとなり、2025年から2034年にかけてCAGR 7%で成長すると予測されています。
オゾンを発生させるオゾン発生器は、空気殺菌、水質浄化、悪臭防止、様々な工業プロセスに広く使用されています。これらのシステムは、コロナ放電、紫外線照射、低温プラズマ、電解プロセスなどの方法を利用してオゾンを効率的に生成します。
新興国や発展途上国における急速な商業化と都市化が、製品採用を促進する主な要因となっています。特に新興国市場の都市部では、オゾンベースの空気・水処理システムに対するニーズが高まっており、これが市場の大幅な成長を促しています。人口密度の高い地域における汚染レベルの上昇と、水質・大気質改善に対する政府の支援政策が、市場の状況をさらに強化しています。環境問題に直面している国々では、その有効性と環境に優しい特性から、オゾン技術の導入が増加しています。
| 市場範囲 | |
|---|---|
| 開始年 | 2024 |
| 予測年 | 2025-2034 |
| 開始金額 | 4億4,190万米ドル |
| 予測金額 | 8億5,700万米ドル |
| CAGR | 7% |
技術面では、コロナ放電分野は2034年までに3億6,400万米ドルを生み出すと予想されています。このセグメントの成長は、大量のオゾンを効率的に生成する能力によるもので、自治体の水処理や工業プロセスなどの大規模用途に最適です。費用対効果が高く、メンテナンスの手間が少ないオゾン生成技術に対する需要の高まりが、普及の原動力となっています。さらに、空気浄化、廃水処理、食品安全、医療殺菌などの用途におけるコロナ放電技術の汎用性が、市場拡大をさらに後押ししています。
実験室・医療機器分野は、2034年までCAGR 8.5%で成長すると予測されています。細菌、ウイルス、その他の病原体を除去する効果的な滅菌方法に対するニーズの高まりが、ヘルスケアや研究所でのオゾン発生器の使用を加速しています。衛生基準や安全基準に対する規制の重視の高まりと、オゾン殺菌システムの環境に優しく化学物質を使用しない性質は、FDAやEPAなどの機関が設定したガイドラインに合致しています。このような規制遵守と効果的な殺菌ソリューションへの注目は、大きな成長機会を生み出しています。
米国のオゾン発生器市場は、環境保護庁(EPA)などの機関による厳しい環境規制によって、2034年までに1億6,400万米ドルを創出すると予想されています。室内空気汚染やアレルゲンに対する懸念の高まりが、住宅、商業、工業の各分野におけるオゾンベースの空気処理システムの需要を促進しています。さらに、リアルタイムで性能を最適化するためのIoT対応監視・制御システムの統合など、オゾン技術の進歩が効率とユーザーの利便性を高め、市場の成長をさらに後押ししています。
目次
第1章 調査手法と調査範囲
- 市場の定義
- 基本推定と計算
- 予測計算
- 1次調査と検証
- 一次情報
- データマイニングソース
- 市場の定義
第2章 エグゼクティブサマリー
第3章 業界洞察
- 業界エコシステム
- 規制状況
- 業界への影響要因
- 促進要因
- 業界の潜在的リスク&課題
- 成長可能性分析
- ポーターの分析
- 供給企業の交渉力
- 買い手の交渉力
- 新規参入業者の脅威
- 代替品の脅威
- PESTEL分析
第4章 競争情勢
- イントロダクション
- 戦略ダッシュボード
- イノベーションと技術展望
第5章 市場規模・予測:技術別、2021年~2034年
- 主要動向
- 紫外線
- コールドプラズマ
- コロナ放電
- 電解
第6章 市場規模・予測:用途別、2021年~2034年
- 主要動向
- 水処理
- 市水処理
- 工業用プロセス水処理
- その他
- 実験室・医療機器
- 空気処理
- その他
第7章 市場規模・予測:最終用途別、2021年~2034年
- 主要動向
- 商業用
- 自治体
- 産業用
- 自動車
- 食品・飲料
- 繊維
- 製薬
- その他
第8章 市場規模・予測:生産能力別、2021年~2034年
- 主要動向
- 5 gm/hr以下
- 5 gm/hr-100 gm/hr
- 100 gm/hr-1 kg/hr
- 1 kg/hr-5 kg/hr
- 5 kg/hr超
第9章 市場規模・予測:地域別、2021年~2034年
- 主要動向
- 北米
- 米国
- カナダ
- 欧州
- ドイツ
- 英国
- フランス
- ロシア
- イタリア
- スペイン
- アジア太平洋
- 中国
- オーストラリア
- インド
- 日本
- 韓国
- 中東・アフリカ
- サウジアラビア
- アラブ首長国連邦
- エジプト
- トルコ
- 南アフリカ
- ラテンアメリカ
- ブラジル
- アルゼンチン
第10章 企業プロファイル
- Chemtronics
- Corotec
- DEL Ozone
- EBARA Technologies
- ESCO International
- Faraday Ozone
- Lenntech Water Treatment
- Mitsubishi Electric
- Oxyzone
- Ozone Solutions
- Ozonetek
- Primozone
- Sewec Ozon
- SUEZ
- Toshiba
The Global Ozone Generator Market was valued at USD 441.9 million in 2024 and is projected to grow at a CAGR of 7% between 2025 and 2034. Ozone generators, which produce ozone, are widely used for air disinfection, water purification, odor control, and various industrial processes. These systems utilize methods like corona discharge, ultraviolet radiation, cold plasma, and electrolytic processes to generate ozone efficiently.
Rapid commercialization and urbanization in emerging and underdeveloped economies are key factors driving product adoption. The increasing need for ozone-based air and water treatment systems, especially in urban areas of developing regions, is fostering significant market growth. Rising pollution levels in densely populated regions and supportive government policies for water and air quality improvement are further strengthening the market landscape. Countries facing environmental challenges are increasingly deploying ozone technology for its effectiveness and eco-friendly attributes.
| Market Scope | |
|---|---|
| Start Year | 2024 |
| Forecast Year | 2025-2034 |
| Start Value | $441.9 Million |
| Forecast Value | $857 Million |
| CAGR | 7% |
In terms of technology, the corona discharge segment is expected to generate USD 364 million by 2034. This segment's growth is attributed to its capability to produce high amounts of ozone effectively, making it ideal for large-scale applications such as municipal water treatment and industrial processes. The growing demand for cost-effective, low-maintenance ozone generation technologies is driving adoption. Additionally, the versatility of corona discharge technology in applications like air purification, wastewater treatment, food safety, and medical sterilization is further boosting market expansion.
The laboratory and medical equipment segment is anticipated to grow at a CAGR of 8.5% through 2034. The rising need for effective sterilization methods to eliminate bacteria, viruses, and other pathogens is accelerating the use of ozone generators in healthcare and laboratories. Increasing regulatory emphasis on hygiene and safety standards, along with the eco-friendly and chemical-free nature of ozone disinfection systems, aligns with guidelines set by agencies like the FDA and EPA. This focus on regulatory compliance and effective sterilization solutions creates significant growth opportunities.
U.S. ozone generator market is expected to generate USD 164 million through 2034, driven by stringent environmental regulations from agencies like the Environmental Protection Agency (EPA). Rising concerns over indoor air pollution and allergens are fueling demand for ozone-based air treatment systems across residential, commercial, and industrial sectors. Additionally, advancements in ozone technology, including the integration of IoT-enabled monitoring and control systems for real-time performance optimization, are enhancing efficiency and user convenience, further supporting market growth.
Table of Contents
Chapter 1 Methodology & Scope
- 1.1 Market definitions
- 1.2 Base estimates & calculations
- 1.3 Forecast calculation
- 1.4 Primary research & validation
- 1.4.1 Primary sources
- 1.4.2 Data mining sources
- 1.5 Market Definitions
Chapter 2 Executive Summary
- 2.1 Industry synopsis, 2021 – 2034
Chapter 3 Industry Insights
- 3.1 Industry ecosystem
- 3.2 Regulatory landscape
- 3.3 Industry impact forces
- 3.3.1 Growth drivers
- 3.3.2 Industry pitfalls & challenges
- 3.4 Growth potential analysis
- 3.5 Porter's analysis
- 3.5.1 Bargaining power of suppliers
- 3.5.2 Bargaining power of buyers
- 3.5.3 Threat of new entrants
- 3.5.4 Threat of substitutes
- 3.6 PESTEL analysis
Chapter 4 Competitive landscape, 2024
- 4.1 Introduction
- 4.2 Strategic dashboard
- 4.3 Innovation & technology landscape
Chapter 5 Market Size and Forecast, By Technology, 2021 – 2034 (USD Million & Units)
- 5.1 Key trends
- 5.2 Ultraviolet
- 5.3 Cold Plasma
- 5.4 Corona Discharge
- 5.5 Electrolytic
Chapter 6 Market Size and Forecast, By Application, 2021 – 2034 (USD Million & Units)
- 6.1 Key trends
- 6.2 Water treatment
- 6.2.1 Municipal water treatment
- 6.2.2 Industrial process water treatment
- 6.2.3 Others
- 6.3 Laboratory & medical equipment
- 6.4 Air treatment
- 6.5 Others
Chapter 7 Market Size and Forecast, By End Use, 2021 – 2034 (USD Million & Units)
- 7.1 Key trends
- 7.2 Commercial
- 7.3 Municipal
- 7.4 Industrial
- 7.4.1 Automotive
- 7.4.2 Food & beverages
- 7.4.3 Textile
- 7.4.4 Pharmaceutical
- 7.4.5 Others
Chapter 8 Market Size and Forecast, By Capacity, 2021 – 2034 (USD Million & Units)
- 8.1 Key trends
- 8.2 ≤ 5 gm/hr
- 8.3 5 gm/hr - 100 gm/hr
- 8.4 100 gm/hr - 1 kg/hr
- 8.5 1 kg/hr - 5 kg/hr
- 8.6 > 5 kg/hr
Chapter 9 Market Size and Forecast, By Region, 2021 – 2034 (USD Million & Units)
- 9.1 Key trends
- 9.2 North America
- 9.2.1 U.S.
- 9.2.2 Canada
- 9.3 Europe
- 9.3.1 Germany
- 9.3.2 UK
- 9.3.3 France
- 9.3.4 Russia
- 9.3.5 Italy
- 9.3.6 Spain
- 9.4 Asia Pacific
- 9.4.1 China
- 9.4.2 Australia
- 9.4.3 India
- 9.4.4 Japan
- 9.4.5 South Korea
- 9.5 Middle East & Africa
- 9.5.1 Saudi Arabia
- 9.5.2 UAE
- 9.5.3 Egypt
- 9.5.4 Turkey
- 9.5.5 South Africa
- 9.6 Latin America
- 9.6.1 Brazil
- 9.6.2 Argentina
Chapter 10 Company Profiles
- 10.1 Chemtronics
- 10.2 Corotec
- 10.3 DEL Ozone
- 10.4 EBARA Technologies
- 10.5 ESCO International
- 10.6 Faraday Ozone
- 10.7 Lenntech Water Treatment
- 10.8 Mitsubishi Electric
- 10.9 Oxyzone
- 10.10 Ozone Solutions
- 10.11 Ozonetek
- 10.12 Primozone
- 10.13 Sewec Ozon
- 10.14 SUEZ
- 10.15 Toshiba

