
アラビノキシラン繊維の市場の機会、成長促進要因、産業動向分析、2025年~2034年の予測
Arabinoxylan Fiber Market Opportunity, Growth Drivers, Industry Trend Analysis, and Forecast 2025 - 2034- 発行日
- ページ情報
- 英文 235 Pages
- 納期
- 2~3営業日
- 商品コード
- 1666910
- カスタマイズ可能 お客様のご希望に応じて、既存データの加工や未掲載情報(例:国別セグメント)の追加などの対応が可能です。詳細はお問い合わせください。
- 翻訳ツール提供対象 PDF対応AI翻訳ツールの無料貸し出しサービスのご利用が可能です
概要
アラビノキシラン繊維の世界市場は、2024年に3,250万米ドルと評価され、2025年から2034年にかけて7.6%の堅調なCAGRで成長すると予測されています。
この成長の原動力は、飲食品産業の拡大と抽出・精製技術の進歩です。天然成分や機能性成分への需要が高まるにつれ、革新的な抽出方法によって生産効率が向上し、サプライヤーは食品、飲料、サプリメント分野からのニーズの高まりに対応できるようになっています。
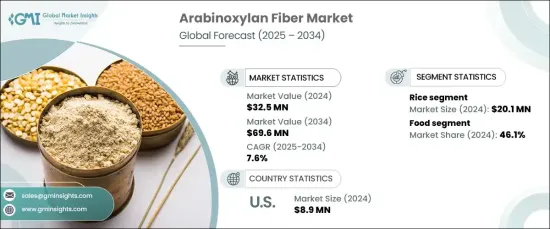
米ベースのセグメントは市場を独占し、2024年には2,000万米ドルを生み出し、2025年から2034年にかけてCAGR 9%で成長すると予測されています。この成長は、世界的に米が広く消費されていることと、アラビノキシランを豊富に含んでいることに起因しています。さらに、米の加工技術の開発が進み、米ぬかからアラビノキシラン繊維をより効率的に抽出できるようになったことが、このセグメントの存在感をさらに高めています。消費者が代替の身近な繊維源をますます求めるようになる中、米を原料とする製品は引き続き人気を集めています。
| 市場範囲 | |
|---|---|
| 開始年 | 2024 |
| 予測年 | 2025-2034 |
| 開始金額 | 3,250万米ドル |
| 予測金額 | 6,960万米ドル |
| CAGR | 7.6% |
食品分野はアラビノキシラン繊維市場の主要な貢献者として浮上し、2024年には1,500万米ドルの価値に達し、2034年までの予想CAGRは8.9%です。食物繊維を強化した機能性食品に対する需要の高まりが、消費者が食生活の選択において健康とウェルネスを優先するため、この成長に拍車をかけています。アラビノキシラン繊維はその健康上の利点で知られ、栄養プロファイルを強化するために様々な食品に組み込まれています。この動向は、より健康的で食物繊維の豊富な選択肢を求める消費者の需要に応えるため、食品業界が技術革新に重点を置くようになっていることを反映しており、アラビノキシランは最新の食品製剤に不可欠な成分として位置付けられています。
米国のアラビノキシラン繊維市場は、2024年に750万米ドルを占め、2025年から2034年にかけてCAGR 8%で成長するとみられています。腸内環境の改善、血糖値の調整、コレステロールの管理といった食物繊維の利点に対する消費者の意識の高まりが、同国全体の需要を牽引しています。主に小麦やトウモロコシなどの穀物から得られるアラビノキシラン繊維は、機能性食品、飲食品、栄養補助食品で人気を集めています。ナチュラルでクリーンラベルの製品へのシフトが進んでいることは、健康志向の高まりと合致しており、市場の成長をさらに後押ししています。食品加工技術の進歩も食物繊維の機能性を高め、栄養補助食品やその他の健康志向の製品での利用を拡大しています。
目次
第1章 調査手法と調査範囲
- 市場範囲と定義
- 基本推定と計算
- 予測計算
- データソース
- 1次データ
- 2次データ
- 有料情報源
- 公的情報源
第2章 エグゼクティブサマリー
第3章 業界洞察
- エコシステム分析
- バリューチェーンに影響を与える要因
- 利益率分析
- 破壊
- 将来の展望
- メーカー
- 流通業者
- サプライヤーの状況
- 利益率分析
- 主要ニュース
- 規制状況
- 影響要因
- 促進要因
- 食物繊維の利点に対する認識の高まり
- より健康的で食物繊維が豊富な食品への動向の高まり
- 研究と技術革新の増加
- 天然素材や植物由来素材の人気の高まり
- 業界の潜在的リスク&課題
- 高い生産コスト
- 他の繊維との競合
- 促進要因
- 成長可能性分析
- ポーターの分析
- PESTEL分析
第4章 競合情勢
- イントロダクション
- 企業シェア分析
- 競合のポジショニング・マトリックス
- 戦略展望マトリックス
第5章 市場推計・予測:供給元別、2021年~2034年
- 主要動向
- 小麦
- 米
- 大麦
- オート麦
- トウモロコシ
- その他
第6章 市場推計・予測:用途別、2021-2034年
- 主要動向
- 食品
- ベーカリー
- 朝食用シリアル&スナック
- 菓子類
- 乳製品
- 肉製品
- 乳児用食品
- 飲料
- 医薬品
- 動物栄養
- 豚
- 反芻動物
- 家禽
- ペット
- その他(パーソナルケア&化粧品)
第7章 市場推計・予測:地域別、2021-2034年
- 主要動向
- 北米
- 米国
- カナダ
- 欧州
- 英国
- ドイツ
- フランス
- イタリア
- スペイン
- ロシア
- アジア太平洋
- 中国
- インド
- 日本
- 韓国
- オーストラリア
- ラテンアメリカ
- ブラジル
- メキシコ
- 中東・アフリカ
- 南アフリカ
- サウジアラビア
- アラブ首長国連邦
第8章 企業プロファイル
- Acetar Bio-tech Inc.
- Antimex Pharmaceuticals &Chemicals Ltd.
- BioActor BV
- Cargill
- Comet Biorefining
- Daiwa Pharmaceutical
- HL Agro
- JRS
- Kowa India Pvt. Ltd.
- Megazyme
- Raymon Biotech
- Shandong Zhi Shang Chemical Co., Ltd.
- Triumph International Development Limited
目次
The Global Arabinoxylan Fiber Market was valued at USD 32.5 million in 2024 and is anticipated to grow at a robust CAGR of 7.6% from 2025 to 2034. This growth is driven by the expanding food and beverage industry and advancements in extraction and purification technologies. As demand rises for natural and functional ingredients, innovative extraction methods are improving production efficiency, allowing suppliers to meet increasing needs from the food, beverage, and supplement sectors.
The rice-based segment dominated the market, generating USD 20 million in 2024, and is projected to grow at a CAGR of 9% through 2025-2034. This growth is attributed to the widespread consumption of rice globally and its rich arabinoxylan content. Additionally, ongoing developments in rice processing technologies have enabled more efficient extraction of arabinoxylan fiber from rice bran, further boosting the segment's prominence. With consumers increasingly seeking alternative and familiar fiber sources, rice-based products continue to gain traction.
| Market Scope | |
|---|---|
| Start Year | 2024 |
| Forecast Year | 2025-2034 |
| Start Value | $32.5 Million |
| Forecast Value | $69.6 Million |
| CAGR | 7.6% |
The food segment emerged as a key contributor to the arabinoxylan fiber market, reaching a value of USD 15 million in 2024, with an anticipated CAGR of 8.9% by 2034. Rising demand for functional foods enriched with dietary fiber has fueled this growth as consumers prioritize health and wellness in their dietary choices. Arabinoxylan fiber, renowned for its health benefits, is being incorporated into various food products to enhance their nutritional profile. This trend reflects the food industry's growing focus on innovation to meet consumer demand for healthier and fiber-rich options, positioning arabinoxylan as a vital ingredient in modern food formulations.
U.S. arabinoxylan fiber market accounted for USD 7.5 million in 2024 and is set to grow at 8% CAGR from 2025 to 2034. Increasing consumer awareness of the benefits of dietary fiber-such as improving gut health, regulating blood sugar, and managing cholesterol-is driving demand across the country. Derived primarily from cereal grains like wheat and corn, arabinoxylan fiber is gaining traction in functional foods, beverages, and dietary supplements. The ongoing shift toward natural, clean-label products aligns with the growing health and wellness trend, further bolstering market growth. Advancements in food processing technologies are also enhancing the fiber's functionality, expanding its use across nutraceuticals and other health-focused products.
Table of Contents
Chapter 1 Methodology & Scope
- 1.1 Market scope & definitions
- 1.2 Base estimates & calculations
- 1.3 Forecast calculations
- 1.4 Data sources
- 1.4.1 Primary
- 1.4.2 Secondary
- 1.4.2.1 Paid sources
- 1.4.2.2 Public sources
Chapter 2 Executive Summary
- 2.1 Industry synopsis, 2021-2034
Chapter 3 Industry Insights
- 3.1 Industry ecosystem analysis
- 3.1.1 Factor affecting the value chain
- 3.1.2 Profit margin analysis
- 3.1.3 Disruptions
- 3.1.4 Future outlook
- 3.1.5 Manufacturers
- 3.1.6 Distributors
- 3.2 Supplier landscape
- 3.3 Profit margin analysis
- 3.4 Key news & initiatives
- 3.5 Regulatory landscape
- 3.6 Impact forces
- 3.6.1 Growth drivers
- 3.6.1.1 Increased awareness of the benefits of dietary fibers
- 3.6.1.2 Growing trend toward healthier, fiber-rich food products
- 3.6.1.3 Increasing research and innovation
- 3.6.1.4 Rising popularity of natural and plant-based ingredients
- 3.6.2 Industry pitfalls & challenges
- 3.6.2.1 High production costs
- 3.6.2.2 Competition from other fibers
- 3.6.1 Growth drivers
- 3.7 Growth potential analysis
- 3.8 Porter’s analysis
- 3.9 PESTEL analysis
Chapter 4 Competitive Landscape, 2024
- 4.1 Introduction
- 4.2 Company market share analysis
- 4.3 Competitive positioning matrix
- 4.4 Strategic outlook matrix
Chapter 5 Market Estimates & Forecast, By Source, 2021-2034 (USD Million) (Kilo Tons)
- 5.1 Key trends
- 5.2 Wheat
- 5.3 Rice
- 5.4 Barley
- 5.5 Oats
- 5.6 Maize
- 5.7 Others
Chapter 6 Market Estimates & Forecast, By Application, 2021-2034 (USD Million) (Kilo Tons)
- 6.1 Key trends
- 6.2 Food
- 6.2.1 Bakery
- 6.2.2 Breakfast cereals & snacks
- 6.2.3 Confectionery
- 6.2.4 Dairy
- 6.2.5 Meat products
- 6.2.6 Infant food
- 6.3 Beverages
- 6.4 Pharmaceutical
- 6.5 Animal nutrition
- 6.5.1 Swine
- 6.5.2 Ruminants
- 6.5.3 Poultry
- 6.5.4 Pet
- 6.6 Others (personal care & cosmetics)
Chapter 7 Market Estimates & Forecast, By Region, 2021-2034 (USD Million) (Kilo Tons)
- 7.1 Key trends
- 7.2 North America
- 7.2.1 U.S.
- 7.2.2 Canada
- 7.3 Europe
- 7.3.1 UK
- 7.3.2 Germany
- 7.3.3 France
- 7.3.4 Italy
- 7.3.5 Spain
- 7.3.6 Russia
- 7.4 Asia Pacific
- 7.4.1 China
- 7.4.2 India
- 7.4.3 Japan
- 7.4.4 South Korea
- 7.4.5 Australia
- 7.5 Latin America
- 7.5.1 Brazil
- 7.5.2 Mexico
- 7.6 MEA
- 7.6.1 South Africa
- 7.6.2 Saudi Arabia
- 7.6.3 UAE
Chapter 8 Company Profiles
- 8.1 Acetar Bio-tech Inc.
- 8.2 Antimex Pharmaceuticals & Chemicals Ltd.
- 8.3 BioActor BV
- 8.4 Cargill
- 8.5 Comet Biorefining
- 8.6 Daiwa Pharmaceutical
- 8.7 HL Agro
- 8.8 JRS
- 8.9 Kowa India Pvt. Ltd.
- 8.10 Megazyme
- 8.11 Raymon Biotech
- 8.12 Shandong Zhi Shang Chemical Co., Ltd.
- 8.13 Triumph International Development Limited
- 発行日
- 発行
- Global Market Insights Inc.
- ページ情報
- 英文 235 Pages
- 納期
- 2~3営業日