
|
市場調査レポート
商品コード
1666666
ガス絶縁中電圧スイッチギヤ市場の機会、成長促進要因、産業動向分析、2025年~2034年の予測Gas Insulated Medium Voltage Switchgear Market Opportunity, Growth Drivers, Industry Trend Analysis, and Forecast 2025 - 2034 |
||||||
カスタマイズ可能
|
|||||||
| ガス絶縁中電圧スイッチギヤ市場の機会、成長促進要因、産業動向分析、2025年~2034年の予測 |
|
出版日: 2024年12月20日
発行: Global Market Insights Inc.
ページ情報: 英文 100 Pages
納期: 2~3営業日
|

全表示
- 概要
- 目次
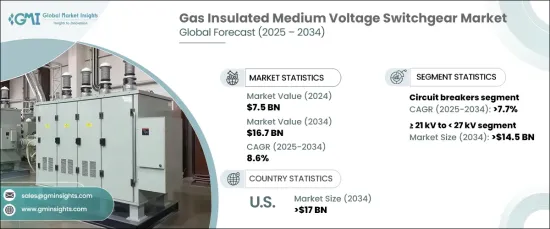
2024年に75億米ドルと評価されたガス絶縁中電圧スイッチギヤの世界市場は、2025年から2034年にかけてCAGR 8.6%と予測され、著しい成長を遂げようとしています。
この急成長は、発電、公益事業、商業部門などの産業で、コンパクトで信頼性が高く効率的な電気ソリューションに対する需要が高まっていることを反映しています。都市化が加速し、再生可能エネルギーの統合が進む中、GISは従来の空気絶縁開閉装置に代わる優れた選択肢として登場し、性能の向上、安全性の改善、設置面積の大幅な縮小を実現しています。これらの特性により、GISは都市環境やスペースに制約のある地域にとって理想的なソリューションとなり、現代のインフラ・ニーズにシームレスに合致します。
世界が風力発電や太陽光発電のような再生可能エネルギーに移行する中、進化するエネルギー情勢はGISの採用を拡大する重要なきっかけとなっています。GISシステムは、再生可能エネルギーの断続性の管理に優れており、信頼性と適応性の高いインフラ・ソリューションを提供します。先進的な監視・診断システムなどの革新的技術により、運用効率と信頼性が向上し、技術の進歩がGISの魅力をさらに高めています。これらの進歩は、電力システムの近代化を目指す産業界における、持続可能で堅牢な、将来対応可能なエネルギー・ソリューションに対する差し迫った需要に応えています。
| 市場範囲 | |
|---|---|
| 開始年 | 2024 |
| 予測年 | 2025-2034 |
| 開始金額 | 75億米ドル |
| 予測金額 | 167億米ドル |
| CAGR | 8.6% |
市場を電圧別に分類すると、21kV以上27kV未満が突出しており、2034年までに145億米ドルの売上が見込まれます。この電圧範囲は、産業用、商業用、公益事業用の効率的な配電に不可欠です。変電所を配電ネットワークに接続し、人口密度の高い都市部への信頼性の高い送電を確保し、産業拠点を拡大する上で不可欠な役割を果たしています。このセグメントの主な促進要因には、送電網の信頼性重視の高まり、再生可能エネルギー源の統合、進行中のインフラ近代化プロジェクトなどがあります。
コンポーネント別では、GISのサーキットブレーカーが2034年までCAGR 7.7%と堅調に推移します。サーキットブレーカーは、過負荷、短絡、その他の障害から電気回路を保護し、安全で中断のない配電を確保するために不可欠です。産業界がシステムの信頼性と安全性を優先する中、高度なサーキットブレーカー・ソリューションの需要は伸び続け、最新のGISシステムにおける重要なコンポーネントとしての役割を確固たるものにしています。
米国のガス絶縁中電圧スイッチギヤ市場は、効率的で省スペースかつ高性能な配電ソリューションへのニーズの高まりにより、2034年までに170億米ドルに達すると予想されています。特に再生可能エネルギーに対応するため、送電網の拡張とインフラの近代化が勢いを増す中、GISの採用が増加しています。優れた信頼性、強化された安全性、メンテナンス要件の削減といった利点により、GISは米国の配電枠組みの礎石となりつつあり、都市と産業環境の両方の進化する需要に対応しています。
目次
第1章 調査手法と調査範囲
- 市場の定義
- 基本推定と計算
- 予測計算
- データソース
- 1次データ
- 2次データ
- 有償
- 公的
第2章 エグゼクティブサマリー
第3章 業界洞察
- エコシステム分析
- 規制状況
- 業界への影響要因
- 促進要因
- 業界の潜在的リスク&課題
- 成長可能性分析
- ポーターの分析
- 供給企業の交渉力
- 買い手の交渉力
- 新規参入業者の脅威
- 代替品の脅威
- PESTEL分析
第4章 競合情勢
- 戦略ダッシュボード
- イノベーションと持続可能性の展望
第5章 市場規模・予測:電圧別、2021年~2034年
- 主要動向
- 3 kV以上~9 kV未満
- 9 kV以上~15 kV未満
- 15 kV以上~21 kV未満
- 21 kV以上~27 kV未満
- 27 kV以上~33 kV未満
- 33 kV以上~36 kV未満
- 36 kV以上
第6章 市場規模・予測:コンポーネント別、2021年~2034年
- 主要動向
- サーキットブレーカー
- 接触器
- スイッチ&ディスコネクト
- ヒューズ
- その他
第7章 市場規模・予測:最終用途別、2021年~2034年
- 主要動向
- 発電所
- 変電所
- 地域電力供給
- その他
第8章 市場規模・予測:用途別、2021年~2034年
- 主要動向
- 住宅用
- 商業用
- 産業用
- ユーティリティ
第9章 市場規模・予測:地域別、2021~2034年
- 主要動向
- 北米
- 米国
- カナダ
- メキシコ
- 欧州
- 英国
- フランス
- ドイツ
- イタリア
- ロシア
- スペイン
- アジア太平洋
- 中国
- オーストラリア
- インド
- 日本
- 韓国
- 中東・アフリカ
- サウジアラビア
- アラブ首長国連邦
- トルコ
- 南アフリカ
- エジプト
- ラテンアメリカ
- ブラジル
- アルゼンチン
第10章 企業プロファイル
- ABB
- Bharat Heavy Electricals
- CG Power and Industrial Solutions
- E+I Engineering
- Eaton
- Fuji Electric
- General Electric
- HD Hyundai Electric
- Hitachi
- Hyosung Heavy Industries
- Lucy Group
- Mitsubishi Electric
- Ormazabal
- Schneider Electric
- Siemens
- Skema
- Toshiba
The Global Gas Insulated Medium Voltage Switchgear Market, valued at USD 7.5 billion in 2024, is poised for remarkable growth with a projected CAGR of 8.6% between 2025 and 2034. This surge reflects the escalating demand for compact, reliable, and efficient electrical solutions across industries such as power generation, utilities, and commercial sectors. As urbanization accelerates and renewable energy integration intensifies, GIS has emerged as a superior alternative to traditional air-insulated switchgear, delivering enhanced performance, improved safety, and a significantly smaller footprint. These attributes make GIS an ideal solution for urban settings and areas with space constraints, aligning seamlessly with modern infrastructure needs.
The evolving energy landscape is a significant catalyst for the growing adoption of GIS, as the world transitions toward renewable sources like wind and solar power. GIS systems excel in managing the intermittency of renewable energy, offering a dependable and adaptable infrastructure solution. Technological advancements have further bolstered their appeal, with innovations such as advanced monitoring and diagnostic systems enhancing operational efficiency and reliability. These advancements meet the pressing demand for sustainable, robust, and future-ready energy solutions in industries seeking to modernize their power systems.
| Market Scope | |
|---|---|
| Start Year | 2024 |
| Forecast Year | 2025-2034 |
| Start Value | $7.5 Billion |
| Forecast Value | $16.7 Billion |
| CAGR | 8.6% |
The market's segmentation by voltage highlights the prominence of the >= 21 kV to 27 kV range, which is forecasted to generate USD 14.5 billion by 2034. This voltage range is crucial for efficient power distribution in industrial, commercial, and utility applications. It plays an indispensable role in connecting substations to distribution networks, ensuring reliable power transmission to densely populated urban areas, and expanding industrial hubs. Key drivers in this segment include the increasing emphasis on grid reliability, the integration of renewable energy sources, and ongoing infrastructure modernization projects.
In terms of components, circuit breakers within GIS are set to experience a robust CAGR of 7.7% through 2034. Circuit breakers are essential for protecting electrical circuits from overloads, short circuits, and other faults, ensuring secure and uninterrupted power distribution. As industries prioritize system reliability and safety, the demand for advanced circuit breaker solutions continues to grow, solidifying their role as a critical component in modern GIS systems.
The U.S. market for gas insulated medium voltage switchgear is anticipated to reach USD 17 billion by 2034, driven by the increasing need for efficient, space-saving, and high-performance power distribution solutions. As grid expansion and infrastructure modernization gain momentum, particularly to accommodate renewable energy, GIS adoption is on the rise. With benefits like superior reliability, enhanced safety, and reduced maintenance requirements, GIS is becoming a cornerstone of the U.S. power distribution framework, addressing the evolving demands of both urban and industrial environments.
Table of Contents
Chapter 1 Methodology & Scope
- 1.1 Market definitions
- 1.2 Base estimates & calculations
- 1.3 Forecast calculation
- 1.4 Data sources
- 1.4.1 Primary
- 1.4.2 Secondary
- 1.4.2.1 Paid
- 1.4.2.2 Public
Chapter 2 Executive Summary
- 2.1 Industry synopsis, 2021 - 2034
Chapter 3 Industry Insights
- 3.1 Industry ecosystem analysis
- 3.2 Regulatory landscape
- 3.3 Industry impact forces
- 3.3.1 Growth drivers
- 3.3.2 Industry pitfalls & challenges
- 3.4 Growth potential analysis
- 3.5 Porter's analysis
- 3.5.1 Bargaining power of suppliers
- 3.5.2 Bargaining power of buyers
- 3.5.3 Threat of new entrants
- 3.5.4 Threat of substitutes
- 3.6 PESTEL analysis
Chapter 4 Competitive landscape, 2024
- 4.1 Strategic dashboard
- 4.2 Innovation & sustainability landscape
Chapter 5 Market Size and Forecast, By Voltage, 2021 – 2034 (USD Million, ‘000 Units)
- 5.1 Key trends
- 5.2 ≥ 3 kV to < 9 kV
- 5.3 ≥ 9 kV to < 15 kV
- 5.4 ≥ 15 kV to < 21 kV
- 5.5 ≥ 21 kV to < 27 kV
- 5.6 ≥ 27 kV to < 33 kV
- 5.7 ≥ 33 kV< 36 kV
- 5.8 > 36 kV
Chapter 6 Market Size and Forecast, By Component, 2021 – 2034 (USD Million, ‘000 Units)
- 6.1 Key trends
- 6.2 Circuit breakers
- 6.3 Contactors
- 6.4 Switches & disconnector
- 6.5 Fuses
- 6.6 Others
Chapter 7 Market Size and Forecast, By End Use, 2021 – 2034 (USD Million, ‘000 Units)
- 7.1 Key trends
- 7.2 Power stations
- 7.3 Transformer substations
- 7.4 Local electricity supply
- 7.5 Others
Chapter 8 Market Size and Forecast, By Application, 2021 – 2034 (USD Million, ‘000 Units)
- 8.1 Key trends
- 8.2 Residential
- 8.3 Commercial
- 8.4 Industrial
- 8.5 Utility
Chapter 9 Market Size and Forecast, By Region, 2021 – 2034 (USD Million, ‘000 Units)
- 9.1 Key trends
- 9.2 North America
- 9.2.1 U.S.
- 9.2.2 Canada
- 9.2.3 Mexico
- 9.3 Europe
- 9.3.1 UK
- 9.3.2 France
- 9.3.3 Germany
- 9.3.4 Italy
- 9.3.5 Russia
- 9.3.6 Spain
- 9.4 Asia Pacific
- 9.4.1 China
- 9.4.2 Australia
- 9.4.3 India
- 9.4.4 Japan
- 9.4.5 South Korea
- 9.5 Middle East & Africa
- 9.5.1 Saudi Arabia
- 9.5.2 UAE
- 9.5.3 Turkey
- 9.5.4 South Africa
- 9.5.5 Egypt
- 9.6 Latin America
- 9.6.1 Brazil
- 9.6.2 Argentina
Chapter 10 Company Profiles
- 10.1 ABB
- 10.2 Bharat Heavy Electricals
- 10.3 CG Power and Industrial Solutions
- 10.4 E + I Engineering
- 10.5 Eaton
- 10.6 Fuji Electric
- 10.7 General Electric
- 10.8 HD Hyundai Electric
- 10.9 Hitachi
- 10.10 Hyosung Heavy Industries
- 10.11 Lucy Group
- 10.12 Mitsubishi Electric
- 10.13 Ormazabal
- 10.14 Schneider Electric
- 10.15 Siemens
- 10.16 Skema
- 10.17 Toshiba

