
|
市場調査レポート
商品コード
1750536
スマートガスメーターの市場機会、成長促進要因、産業動向分析、2025年~2034年予測Smart Gas Meters Market Opportunity, Growth Drivers, Industry Trend Analysis, and Forecast 2025 - 2034 |
||||||
カスタマイズ可能
|
|||||||
| スマートガスメーターの市場機会、成長促進要因、産業動向分析、2025年~2034年予測 |
|
出版日: 2025年05月16日
発行: Global Market Insights Inc.
ページ情報: 英文 123 Pages
納期: 2~3営業日
|

全表示
- 概要
- 目次
スマートガスメーターの世界市場規模は、2024年に66億米ドルとなり、CAGR 16.9%で成長し、2034年には315億米ドルに達すると推定されています。
この成長軌道は、主に正確な請求、より良い消費監視、リアルタイムで損失を検出する能力に対する需要の増加が原動力となっています。公益事業者が業務の効率化を推し進める中、スマートメータリングシステムは、特に住宅および商業ユーザーの間で大きな支持を集めています。エネルギー使用に対する消費者の意識の高まりは、先進技術の統合とともに、さまざまな分野でのこれらのメーターの採用をさらに加速させています。様々な地域の政府も公益事業インフラのデジタル化を推進しており、民間・公共双方の利害関係者がインテリジェント・ガス計測システムに投資する強力なインセンティブとなっています。これらのメーターにより、ユーザーはガス使用量をリアルタイムでモニターし、エネルギー消費を最適化し、最終的には月々の請求額を削減することができます。さらに、より持続可能で環境に配慮したエネルギー消費へのシフトが、エネルギーの説明責任と透明性を高めるシステムの採用を各産業に促しています。
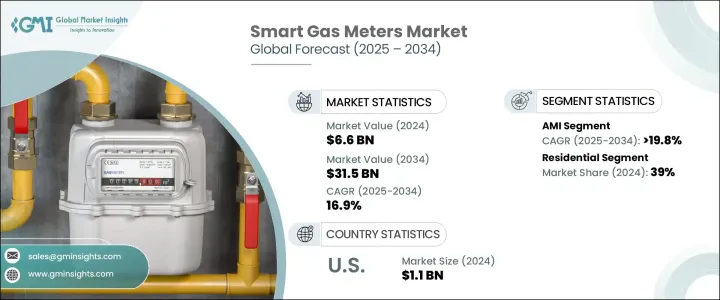
同市場は、技術別に高度計測インフラ(AMI)と自動検針(AMR)に分類されます。中でもAMI分野は著しい成長を遂げ、予測期間中のCAGRは19.8%を超えると予測されています。この成長は、より広範な国や地域の近代化イニシアチブの一環として、スマートインフラが広く展開されていることに起因しています。AMIソリューションは、ユーティリティ企業とエンドユーザー間の双方向通信を提供し、ガス使用量のよりダイナミックな制御とリアルタイムのデータ収集を可能にします。これらの機能は、迅速な問題解決をサポートするだけでなく、エネルギー管理の改善や公益事業者の長期的なコスト削減にも貢献します。ユーティリティ企業がデジタルトランスフォーメーションへの投資を続ける中、AMIは今後数年間、技術展望を支配すると予想されます。
| 市場範囲 | |
|---|---|
| 開始年 | 2024 |
| 予測年 | 2025-2034 |
| 開始金額 | 66億米ドル |
| 予測金額 | 315億米ドル |
| CAGR | 16.9% |
スマートガスメーター市場は、用途別では商業、住宅、公共事業に区分されます。住宅分野は2024年の世界市場シェアの約39%を占め、他のすべての分野をリードしています。消費者はエネルギー使用状況をリアルタイムで把握することを求めるようになっており、スマートメーターはそのために必要なツールを提供します。家庭が消費量の削減とエネルギー効率の向上を目指す中、インテリジェント・ガスメーター・ソリューションに対する需要は高まり続けています。よりクリーンなエネルギー源への転換の動向とともに、支援的な規制政策やインセンティブも、このセグメントの拡大に大きく寄与しています。スマートメーターが提供する利便性と費用対効果により、住宅分野では特に魅力的なものとなり、普及を後押ししています。
米国は世界情勢の中で重要な市場として浮上しており、スマートガスメーター市場の情勢は2022年に8億米ドル、2023年に9億米ドル、2024年には11億米ドルに達すると評価されています。同国では、計測システムの急速な技術進歩が見られ、よりクリーンなエネルギー慣行への推進が高まっています。こうした開発により、公益事業者は既存のインフラをよりスマートなものにアップグレードするよう求められています。米国におけるスマートメーターの採用は、環境目標と送電網の信頼性と効率を高める必要性の両方によって促進されています。電力会社や消費者の間でこうしたメーターが受け入れられつつあることから、米国市場は当面、力強い上昇基調を維持すると予想されます。
スマートガスメーター市場の競合情勢は中程度に集中しており、大手5社が合計で市場全体の約35%のシェアを占めています。これらの主要企業は、市場での存在感を高めるため、製造能力の拡大、技術提供の強化、広範な世界・サプライチェーンの構築に注力しています。世界の持続可能性目標に沿った革新的な計測技術を導入するため、研究開発に多額の投資が行われています。エネルギー・プロバイダーやハイテク企業との戦略的提携は、これらの市場リーダーにとって、大規模な契約を確保するための一般的なルートになりつつあります。さらに、現地生産と優れたアフターサービスが重視され、配備の迅速化と顧客満足度の向上に役立っています。
目次
第1章 調査手法と範囲
第2章 エグゼクティブサマリー
第3章 業界考察
- 業界エコシステム
- トランプ政権の関税分析
- 貿易への影響
- 貿易量の混乱
- 報復措置
- 業界への影響
- 供給側の影響(原材料)
- 主要原材料の価格変動
- サプライチェーンの再構築
- 生産コストへの影響
- 需要側の影響(販売価格)
- 最終市場への価格伝達
- 市場シェアの動向
- 消費者の反応パターン
- 供給側の影響(原材料)
- 影響を受ける主要企業
- 戦略的な業界対応
- サプライチェーンの再構成
- 価格設定と製品戦略
- 政策関与
- 展望と今後の検討事項
- 貿易への影響
- 規制情勢
- 業界への影響要因
- 促進要因
- 業界の潜在的リスク&課題
- 成長可能性分析
- ポーター分析
- PESTEL分析
第4章 競合情勢
- イントロダクション
- 企業の市場シェア
- 戦略的ダッシュボード
- 戦略的取り組み
- 競合ベンチマーキング
- イノベーションと持続可能性の情勢
第5章 市場規模・予測:技術別、2021-2034
- 主要動向
- AMI
- AMR
第6章 市場規模・予測:用途別、2021-2034
- 主要動向
- 住宅用
- 商業用
- ユーティリティ
第7章 市場規模・予測:地域別、2021-2034
- 主要動向
- 北米
- 米国
- カナダ
- 欧州
- ドイツ
- 英国
- フランス
- スウェーデン
- イタリア
- アジア太平洋地域
- 中国
- 日本
- インド
- 韓国
- オーストラリア
- 中東・アフリカ
- アラブ首長国連邦
- サウジアラビア
- 南アフリカ
- エジプト
- ラテンアメリカ
- ブラジル
- メキシコ
- アルゼンチン
第8章 企業プロファイル
- Aclara Technologies
- Apator
- Azbil Kimmon
- Chint Group
- Honeywell International
- Itron
- Landis+Gyr
- Neptune Technology Group
- Osaki Electric
- Raychem RPG
- Schneider Electric
- Sensus
- Wasion Group
- Zenner International
The Global Smart Gas Meters Market was valued at USD 6.6 billion in 2024 and is estimated to grow at a CAGR of 16.9% to reach USD 31.5 billion by 2034. This growth trajectory is primarily driven by increasing demand for accurate billing, better consumption monitoring, and the ability to detect losses in real time. As utility providers push for operational efficiency, smart metering systems are gaining significant traction, especially among residential and commercial users. Rising consumer awareness about energy usage, along with the integration of advanced technologies, is further accelerating the adoption of these meters across diverse sectors. Governments across various regions are also promoting digitalization in utility infrastructure, providing a strong incentive for both private and public stakeholders to invest in intelligent gas metering systems. These meters enable users to monitor real-time gas usage, optimize energy consumption, and ultimately reduce monthly bills, which adds considerable value to consumers and providers alike. Additionally, the shift toward more sustainable and environmentally conscious energy consumption is pushing industries to adopt systems that enhance energy accountability and transparency.
The market is categorized by technology into Advanced Metering Infrastructure (AMI) and Automatic Meter Reading (AMR). Among these, the AMI segment is poised for remarkable growth, projected to register a CAGR exceeding 19.8% during the forecast period. This growth is attributed to widespread rollouts of smart infrastructure as part of broader national and regional modernization initiatives. AMI solutions offer two-way communication between utilities and end-users, enabling more dynamic control over gas usage and real-time data collection. These capabilities not only support faster issue resolution but also contribute to improved energy management and long-term cost savings for utility providers. As utilities continue investing in digital transformation, AMI is expected to dominate the technology landscape in the coming years.
| Market Scope | |
|---|---|
| Start Year | 2024 |
| Forecast Year | 2025-2034 |
| Start Value | $6.6 Billion |
| Forecast Value | $31.5 Billion |
| CAGR | 16.9% |
In terms of application, the smart gas meters market is segmented into commercial, residential, and utility sectors. The residential segment accounted for approximately 39% of the global market share in 2024, leading all other segments. Consumers are increasingly seeking real-time visibility into their energy usage, and smart meters provide the tools needed to achieve that. As households aim to reduce consumption and become more energy-efficient, the demand for intelligent gas metering solutions continues to climb. Supportive regulatory policies and incentives, along with the trend of switching to cleaner energy sources, are also contributing significantly to the expansion of this segment. The convenience and cost-effectiveness offered by smart meters make them particularly appealing in the residential space, driving widespread adoption.
The United States has emerged as a key market in the global landscape, with its smart gas meters market valued at USD 800 million in 2022, USD 900 million in 2023, and reaching USD 1.1 billion in 2024. The country is witnessing rapid technological advancements in metering systems and a growing push toward cleaner energy practices. These developments are prompting utility providers to upgrade existing infrastructure with smarter alternatives. The adoption of smart meters in the US is being fueled by both environmental goals and the need to enhance grid reliability and efficiency. The growing acceptance of these meters among utility firms and consumers alike is expected to keep the US market on a strong upward path in the foreseeable future.
The competitive landscape of the smart gas meters market is moderately concentrated, with five major players collectively holding about 35% of the total market share. These key companies are focusing on expanding their manufacturing capabilities, enhancing their technological offerings, and building extensive global supply chains to strengthen their market presence. Significant investments are being funneled into research and development to introduce innovative metering technologies that align with global sustainability goals. Strategic collaborations with energy providers and tech firms are becoming a popular route for these market leaders to secure large-scale contracts. Additionally, there is a strong emphasis on local production and superior after-sales services, which help speed up deployment and improve customer satisfaction.
Table of Contents
Chapter 1 Methodology & Scope
- 1.1 Research design
- 1.2 Base estimates & calculations
- 1.3 Forecast calculation
- 1.4 Primary research & validation
- 1.4.1 Primary sources
- 1.4.2 Data mining sources
- 1.5 Market definitions
Chapter 2 Executive Summary
- 2.1 Industry synopsis, 2021 - 2034
Chapter 3 Industry Insights
- 3.1 Industry ecosystem
- 3.2 Trump administration tariff analysis
- 3.2.1 Impact on trade
- 3.2.1.1 Trade volume disruptions
- 3.2.1.2 Retaliatory measures
- 3.2.2 Impact on the industry
- 3.2.2.1 Supply-side impact (raw materials)
- 3.2.2.1.1 Price volatility in key materials
- 3.2.2.1.2 Supply chain restructuring
- 3.2.2.1.3 Production cost implications
- 3.2.2.2 Demand-side impact (selling price)
- 3.2.2.2.1 Price transmission to end markets
- 3.2.2.2.2 Market share dynamics
- 3.2.2.2.3 Consumer response patterns
- 3.2.2.1 Supply-side impact (raw materials)
- 3.2.3 Key companies impacted
- 3.2.4 Strategic industry responses
- 3.2.4.1 Supply chain reconfiguration
- 3.2.4.2 Pricing and product strategies
- 3.2.4.3 Policy engagement
- 3.2.5 Outlook and future considerations
- 3.2.1 Impact on trade
- 3.3 Regulatory landscape
- 3.4 Industry impact forces
- 3.4.1 Growth drivers
- 3.4.2 Industry pitfalls & challenges
- 3.5 Growth potential analysis
- 3.6 Porter's analysis
- 3.6.1 Bargaining power of suppliers
- 3.6.2 Bargaining power of buyers
- 3.6.3 Threat of new entrants
- 3.6.4 Threat of substitutes
- 3.7 PESTEL analysis
Chapter 4 Competitive landscape, 2024
- 4.1 Introduction
- 4.2 Company market share
- 4.3 Strategic dashboard
- 4.4 Strategic initiative
- 4.5 Competitive benchmarking
- 4.6 Innovation & sustainability landscape
Chapter 5 Market Size and Forecast, By Technology, 2021 - 2034 (‘000 Units, USD Million)
- 5.1 Key trends
- 5.2 AMI
- 5.3 AMR
Chapter 6 Market Size and Forecast, By Application, 2021 - 2034 (‘000 Units, USD Million)
- 6.1 Key trends
- 6.2 Residential
- 6.3 Commercial
- 6.4 Utility
Chapter 7 Market Size and Forecast, By Region, 2021 - 2034 (‘000 Units, USD Million)
- 7.1 Key trends
- 7.2 North America
- 7.2.1 U.S.
- 7.2.2 Canada
- 7.3 Europe
- 7.3.1 Germany
- 7.3.2 UK
- 7.3.3 France
- 7.3.4 Sweden
- 7.3.5 Italy
- 7.4 Asia Pacific
- 7.4.1 China
- 7.4.2 Japan
- 7.4.3 India
- 7.4.4 South Korea
- 7.4.5 Australia
- 7.5 Middle East & Africa
- 7.5.1 UAE
- 7.5.2 Saudi Arabia
- 7.5.3 South Africa
- 7.5.4 Egypt
- 7.6 Latin America
- 7.6.1 Brazil
- 7.6.2 Mexico
- 7.6.3 Argentina
Chapter 8 Company Profiles
- 8.1 Aclara Technologies
- 8.2 Apator
- 8.3 Azbil Kimmon
- 8.4 Chint Group
- 8.5 Honeywell International
- 8.6 Itron
- 8.7 Landis+Gyr
- 8.8 Neptune Technology Group
- 8.9 Osaki Electric
- 8.10 Raychem RPG
- 8.11 Schneider Electric
- 8.12 Sensus
- 8.13 Wasion Group
- 8.14 Zenner International

