
|
市場調査レポート
商品コード
1666545
超薄板ガラスの市場機会、成長促進要因、産業動向分析、2025年~2034年予測Ultra-Thin Glass Market Opportunity, Growth Drivers, Industry Trend Analysis, and Forecast 2025 - 2034 |
||||||
カスタマイズ可能
|
|||||||
| 超薄板ガラスの市場機会、成長促進要因、産業動向分析、2025年~2034年予測 |
|
出版日: 2024年12月02日
発行: Global Market Insights Inc.
ページ情報: 英文 235 Pages
納期: 2~3営業日
|

全表示
- 概要
- 目次
世界の超薄板ガラス市場は、2024年に162億米ドルに達し、2025年から2034年にかけて7.9%のCAGRで堅調に成長すると予測されています。
この成長の原動力となっているのは、軽量で柔軟性があり、耐久性のある材料が不可欠なコンシューマーエレクトロニクス、自動車、エネルギーの各分野における需要の高まりです。
厚さ0.1mmから0.5mmのセグメントが市場を独占し、2024年には104億米ドルを占め、2025年から2034年にはCAGR7.7%で安定した成長を維持すると予想されます。この厚さ範囲の超薄板ガラスは、強度、柔軟性、透明性という独自の組み合わせにより、高い採用率を示しています。これらの特性により、フレキシブルディスプレイ、ウェアラブルデバイス、軽量パネルなど、精度が要求される用途に非常に適しています。自動車やエネルギー分野では、超薄板ガラスは軽量化、燃費向上、ソーラーパネルなどのエネルギーソリューション強化のためにますます使用されるようになっています。さらに、持続可能で高性能な材料に対する需要の高まりがその採用を後押ししており、環境に優しい製造方法の進歩が市場に新たな機会を生み出しています。
| 市場範囲 | |
|---|---|
| 開始年 | 2024年 |
| 予測年 | 2025年~2034年 |
| 開始金額 | 162億米ドル |
| 予測金額 | 352億米ドル |
| CAGR | 7.9% |
超薄板ガラスの主要な製造方法であるフロート法の2024年の市場規模は100億米ドルで、2025年から2034年にかけてCAGR7.8%で成長すると予測されています。このプロセスは、正確な厚みを持つ高品質で均一なガラスシートの生産を保証し、一貫性と性能が重要な用途に理想的です。フロート製法は、コンシューマーエレクトロニクス、自動車、再生可能エネルギーなどの先端材料を必要とする産業でますます使用されるようになっている、薄くて軽いガラスの開発をサポートします。フロート法は、耐久性があり、透明度の高いガラスの需要に応えることができるため、同市場においてその重要性を維持し続けています。
中国は世界の超薄板ガラス市場をリードしており、2024年には41億米ドルを拠出し、2025年から2034年までのCAGRは8.8%と予測されています。同国の市場優位性は、好調なコンシューマーエレクトロニクスセクター、成長する自動車産業、再生可能エネルギーソリューションへの投資の増加によって後押しされています。中国の生産技術の進歩と持続可能性への注力は、市場の成長をさらに加速させています。世界の製造拠点である中国は、フレキシブルディスプレイ、軽量部品、エネルギー効率に優れたアプリケーションにおける超薄板ガラスの需要増に対応できる立場にあります。
全体として、超薄板ガラス市場は、技術の進歩、軽量材料への需要の増加、世界中の産業におけるエネルギー効率に優れた持続可能なソリューションへの強い後押しを原動力として、大幅な拡大が見込まれています。
目次
第1章 調査手法と調査範囲
- 市場範囲と定義
- 基本推定と計算
- 予測計算
- データソース
- 一次
- 二次
- 有料ソース
- 公的ソース
第2章 エグゼクティブサマリー
第3章 業界洞察
- 業界エコシステム分析
- バリューチェーンに影響を与える要因
- 利益率分析
- 変革
- 将来の展望
- メーカー
- 流通業者
- サプライヤーの状況
- 利益率分析
- 主要ニュース
- 規制状況
- 影響要因
- 成長促進要因
- コンシューマーエレクトロニクス需要の増加
- ソーラーパネルへの普及拡大
- 柔軟性と強度を生かした医療機器やセンサーでの使用増加
- 業界の潜在的リスク・課題
- 複雑な製造工程と変動する原料価格
- プラスチックやセラミックなどの代替材料との競合
- 成長促進要因
- 成長可能性分析
- ポーター分析
- PESTEL分析
第4章 競合情勢
- イントロダクション
- 企業市場シェア分析
- 競合のポジショニングマトリックス
- 戦略展望マトリックス
第5章 市場推計・予測:厚さ別、2021年~2034年
- 主要動向
- 0.1mm未満
- 0.1~0.5mm
- 0.5~1.2mm
第6章 市場推計・予測:製造プロセス別、2021年~2034年
- 主要動向
- ダウンドロープロセス
- オーバーフロー融合プロセス
- フロートプロセス
第7章 用途別市場推計・予測:用途別、2021年~2034年
- 主要動向
- 半導体基板
- フラットパネルディスプレイ
- タッチコントロールデバイス
- その他
第8章 市場推計・予測:地域別、2021年~2034年
- 主要動向
- 北米
- 米国
- カナダ
- 欧州
- 英国
- ドイツ
- フランス
- イタリア
- スペイン
- ロシア
- アジア太平洋
- 中国
- インド
- 日本
- 韓国
- オーストラリア
- ラテンアメリカ
- ブラジル
- メキシコ
- 中東・アフリカ
- 南アフリカ
- サウジアラビア
- アラブ首長国連邦
第9章 企業プロファイル
- AGC Inc.
- Central Glass Co. Ltd.
- Changzhou Almaden Co. Ltd.
- Corning Inc.
- CSG Holdings Co. Ltd.
- Emerge Glass
- Luoyang Glass Co. Ltd.
- Nippon Sheet Glass Co., Ltd.
- Noval Glass Co. Ltd.
- Schott AG
- Taiwan Glass Ind
- Xinyi Glass Holdings Ltd.
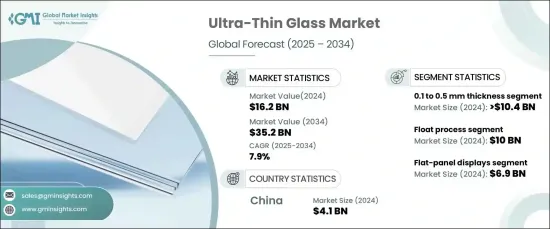
The Global Ultra-Thin Glass Market reached USD 16.2 billion in 2024 and is projected to grow at a robust CAGR of 7.9% during 2025-2034. This growth is driven by rising demand across consumer electronics, automotive, and energy sectors, where lightweight, flexible, and durable materials are essential.
The 0.1 to 0.5 mm thickness segment dominated the market, accounting for USD 10.4 billion in 2024, and is expected to maintain steady growth at a 7.7% CAGR during 2025-2034. Ultra-thin glass in this thickness range is witnessing high adoption due to its unique combination of strength, flexibility, and transparency. These properties make it highly suitable for applications requiring precision, such as flexible displays, wearable devices, and lightweight panels. In the automotive and energy sectors, ultra-thin glass is increasingly used to reduce weight, improve fuel efficiency, and enhance energy solutions, such as solar panels. Additionally, the growing demand for sustainable and high-performance materials is boosting its adoption, while advancements in eco-friendly production methods are creating new opportunities in the market.
| Market Scope | |
|---|---|
| Start Year | 2024 |
| Forecast Year | 2025-2034 |
| Start Value | $16.2 Billion |
| Forecast Value | $35.2 Billion |
| CAGR | 7.9% |
The float process, a key production method for ultra-thin glass, was valued at USD 10 billion in 2024 and is anticipated to grow at a CAGR of 7.8% throughout 2025- 2034. This process ensures the production of high-quality, uniform glass sheets with precise thickness, making it ideal for applications where consistency and performance are critical. The float process supports the development of thin, lightweight glass, which is increasingly used in industries requiring advanced materials, such as consumer electronics, automotive, and renewable energy. The process's ability to meet the demand for durable, high-clarity glass drives its continued significance in the market.
China leads the global ultra-thin glass market, contributing USD 4.1 billion in 2024, with a projected CAGR of 8.8% from 2025 to 2034. The country's market dominance is fueled by its strong consumer electronics sector, growing automotive industry, and increasing investment in renewable energy solutions. China's advancements in production technologies and focus on sustainability are further accelerating the market growth. As a global manufacturing hub, China is well-positioned to meet the rising demand for ultra-thin glass in flexible displays, lightweight components, and energy-efficient applications.
Overall, the ultra-thin glass market is set for significant expansion, driven by technological advancements, increasing demand for lightweight materials, and a strong push for energy-efficient and sustainable solutions across industries worldwide.
Table of Contents
Chapter 1 Methodology & Scope
- 1.1 Market scope & definitions
- 1.2 Base estimates & calculations
- 1.3 Forecast calculations
- 1.4 Data sources
- 1.4.1 Primary
- 1.4.2 Secondary
- 1.4.2.1 Paid sources
- 1.4.2.2 Public sources
Chapter 2 Executive Summary
- 2.1 Industry synopsis, 2021-2034
Chapter 3 Industry Insights
- 3.1 Industry ecosystem analysis
- 3.1.1 Factor affecting the value chain
- 3.1.2 Profit margin analysis
- 3.1.3 Disruptions
- 3.1.4 Future outlook
- 3.1.5 Manufacturers
- 3.1.6 Distributors
- 3.2 Supplier landscape
- 3.3 Profit margin analysis
- 3.4 Key news & initiatives
- 3.5 Regulatory landscape
- 3.6 Impact forces
- 3.6.1 Growth drivers
- 3.6.1.1 Increasing demand for consumer electronics
- 3.6.1.2 Growing penetration in solar panels
- 3.6.1.3 Rising use in medical devices and sensors due to its flexibility and strength
- 3.6.2 Industry pitfalls & challenges
- 3.6.2.1 Complex manufacturing process and fluctuating raw material prices
- 3.6.2.2 Competition from alternative materials such as plastics and ceramics
- 3.6.1 Growth drivers
- 3.7 Growth potential analysis
- 3.8 Porter’s analysis
- 3.9 PESTEL analysis
Chapter 4 Competitive Landscape, 2024
- 4.1 Introduction
- 4.2 Company market share analysis
- 4.3 Competitive positioning matrix
- 4.4 Strategic outlook matrix
Chapter 5 Market Estimates & Forecast, By Thickness, 2021-2034 (USD Billion) (Kilo Tons)
- 5.1 Key trends
- 5.2 Less than 0.1 mm
- 5.3 0.1 to 0.5 mm
- 5.4 0.5 to 1.2 mm
Chapter 6 Market Estimates & Forecast, By Production Process, 2021-2034 (USD Billion) (Kilo Tons)
- 6.1 Key trends
- 6.2 Downdraw process
- 6.3 Overflow- fusion process
- 6.4 Float process
Chapter 7 Market Estimates & Forecast, By Application, 2021-2034 (USD Billion) (Kilo Tons)
- 7.1 Key trends
- 7.2 Semiconductors substrate
- 7.3 Flat-panel displays
- 7.4 Touch-control devices
- 7.5 Others
Chapter 8 Market Estimates & Forecast, By Region, 2021-2034 (USD Billion) (Kilo Tons)
- 8.1 Key trends
- 8.2 North America
- 8.2.1 U.S.
- 8.2.2 Canada
- 8.3 Europe
- 8.3.1 UK
- 8.3.2 Germany
- 8.3.3 France
- 8.3.4 Italy
- 8.3.5 Spain
- 8.3.6 Russia
- 8.4 Asia Pacific
- 8.4.1 China
- 8.4.2 India
- 8.4.3 Japan
- 8.4.4 South Korea
- 8.4.5 Australia
- 8.5 Latin America
- 8.5.1 Brazil
- 8.5.2 Mexico
- 8.6 MEA
- 8.6.1 South Africa
- 8.6.2 Saudi Arabia
- 8.6.3 UAE
Chapter 9 Company Profiles
- 9.1 AGC Inc.
- 9.2 Central Glass Co. Ltd.
- 9.3 Changzhou Almaden Co. Ltd.
- 9.4 Corning Inc.
- 9.5 CSG Holdings Co. Ltd.
- 9.6 Emerge Glass
- 9.7 Luoyang Glass Co. Ltd.
- 9.8 Nippon Sheet Glass Co., Ltd.
- 9.9 Noval Glass Co. Ltd.
- 9.10 Schott AG
- 9.11 Taiwan Glass Ind
- 9.12 Xinyi Glass Holdings Ltd.
