
|
市場調査レポート
商品コード
1665376
OLEDオンシリコン市場の市場機会、成長促進要因、産業動向分析、2025~2034年予測OLED-on-Silicon (OLEDoS) Market Opportunity, Growth Drivers, Industry Trend Analysis, and Forecast 2025 - 2034 |
||||||
カスタマイズ可能
|
|||||||
| OLEDオンシリコン市場の市場機会、成長促進要因、産業動向分析、2025~2034年予測 |
|
出版日: 2024年12月24日
発行: Global Market Insights Inc.
ページ情報: 英文 210 Pages
納期: 2~3営業日
|

全表示
- 概要
- 目次
OLEDオンシリコン(OLEDoS)の世界市場は、2024年に5億4,000万米ドルの評価額を達成し、2025~2034年にかけてCAGR 35.6%を記録し、著しい成長を遂げると予測されています。
この急成長は、卓越した鮮明さ、鮮やかな色彩、シャープなビジュアルを提供する高性能ディスプレイに対する需要の高まりによって推進されています。OLEDoS技術は、その優れた画素密度と卓越した画質により、スマートフォン、ウェアラブル機器、AR/VR製品など、多様な用途で広く採用されるようになっています。
民生用電子機器製品の小型化・高集積化の動向は、市場の拡大をさらに加速させています。デバイスの小型化、軽量化、携帯化が進む中、OLEDoSは、品質に妥協することなく比類のない性能を提供する理想的なディスプレイソリューションとして浮上しています。その超薄型でコンパクトなデザインは、省スペース部品が最も重要な現代の消費者向けガジェットに完全に適しています。
| 市場範囲 | |
|---|---|
| 開始年 | 2024年 |
| 予測年 | 2025~2034年 |
| 開始金額 | 5億4,000万米ドル |
| 予測金額 | 113億米ドル |
| CAGR | 35.6% |
OLEDオンシリコン市場は、近赤外線、赤外線、紫外線、マルチアスペクトラム、その他に分類されます。マルチスペクトラムセグメントは、2034年までに34億米ドルの評価額に達すると予測されています。一方、可視スペクトルセグメントは、仮想現実や拡張現実装置、民生用電子機器製品向けの高解像度ディスプレイで広く使用されていることから、市場を独占することになると考えられます。これらのディスプレイは、優れた輝度、色精度、ビジュアル性能を提供し、ゲーム、自動車、医療など、鮮やかで詳細なビジュアルが重要な産業のニーズに応えています。
用途別では、市場はディスプレイシステム、センシング&検出、画像・検査、光通信、その他に分けられます。このうち、画像処理・検査セグメントは目覚ましい成長を遂げ、2034年のCAGRは38.8%と予測され、最も急成長するセグメントとなっています。しかし、ディスプレイシステムは、民生用電子機器やAR/VR機器におけるエネルギー効率に優れた高性能ディスプレイの需要の高まりに後押しされ、引き続き大きなシェアを占めています。OLEDoS技術は、豊かな色彩、強化された輝度、低消費電力を実現することで差別化を図り、コンパクトで高解像度のディスプレイシステムに最適なソリューションとなっています。
米国のOLEDオンシリコン市場は、2024年に82.1%という驚異的なシェアを獲得し、圧倒的な地位を確立しました。このリーダーシップは、最先端のコンシューマーエレクトロニクスとAR/VRデバイスに対する強い需要によって強化されています。研究開発への旺盛な投資と、持続可能でエネルギー効率の高い技術を支援する政府の取り組みが、米国におけるOLEDオンシリコンの採用をさらに促進し、世界市場における主要参入企業としての地位を確固たるものにしています。
目次
第1章 調査手法と調査範囲
- 市場範囲と定義
- 基本推定と計算
- 予測計算
- データソース
- 一次データ
- 二次データ
- 有料情報源
- 公的情報源
第2章 エグゼクティブサマリー
第3章 産業洞察
- エコシステム分析
- バリューチェーンに影響を与える要因
- 利益率分析
- 変革
- 将来の展望
- メーカー
- 流通業者
- サプライヤーの状況
- 利益率分析
- 主要ニュースと取り組み
- 規制状況
- 影響要因
- 促進要因
- 高解像度ディスプレイに対する需要の高まり
- 民生用電子機器製品の小型化と統合化
- 性能とコスト効率の向上
- 軟質で透明なディスプレイ技術の進歩
- 産業リーダーからの支援と技術提携
- 産業の潜在的リスク・課題
- 高い製造コストと複雑性
- 市場への浸透と消費者の認識が限定的
- 促進要因
- 成長可能性分析
- ポーター分析
- PESTEL分析
第4章 競合情勢
- イントロダクション
- 企業シェア分析
- 競合のポジショニングマトリックス
- 戦略展望マトリックス
第5章 市場推定・予測:光スペクトル別、2021~2034年
- 主要動向
- 可視光域(RGB、フルカラーディスプレイ)
- 近赤外線(NIR, 700~1,400nm)
- 赤外線(IR, 700~3,000nm)
- 紫外線(UV、400nm以下)
- マルチスペクトル(可視+赤外+近赤外)
- その他
第6章 市場推定・予測:用途別、2021~2034年
- 主要動向
- ディスプレイシステム
- センシング&検出
- 画像・検査
- 光通信
- その他
第7章 市場推定・予測:最終用途別、2021~2034年
- 主要動向
- 航空宇宙・防衛
- 民生用電子機器
- 産業・製造
- 医療&メディカル
- 自動車
- その他
第8章 市場推定・予測:地域別、2021~2034年
- 主要動向
- 北米
- 米国
- カナダ
- 欧州
- 英国
- ドイツ
- フランス
- イタリア
- スペイン
- ロシア
- アジア太平洋
- 中国
- インド
- 日本
- 韓国
- オーストラリア
- ラテンアメリカ
- ブラジル
- メキシコ
- 中東・アフリカ
- 南アフリカ
- サウジアラビア
- アラブ首長国連邦
第9章 企業プロファイル
- China Star Optoelectronics Technology(CSOT)
- eMagin Corporation
- Himax Technologies, Inc.
- HOLOEYE Photonics AG
- Innolux Corporation
- JDI(Japan Display Inc.)
- Kopin Corporation
- LG Display Co., Ltd.
- Olightek
- Pixelligent Technologies LLC
- Raystar Optronics Inc.
- Ritek Corporation
- Samsung Electronics Co., Ltd.
- SeeYA Technology
- SiliconCore Technology Inc.
- Sony Corporation
- Tridonic GmbH &Co. KG
- Visionox
- Winstar Display Co., Ltd.
- WiseChip Semiconductor Inc.
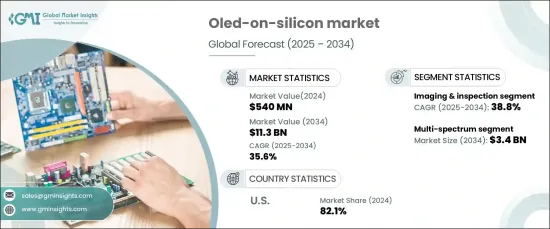
The Global OLED-On-Silicon Market achieved a valuation of USD 540 million in 2024 and is projected to experience remarkable growth, registering a CAGR of 35.6% from 2025 to 2034. This surge is propelled by the escalating demand for high-performance displays that deliver exceptional clarity, vibrant colors, and sharp visuals. OLEDoS technology is gaining widespread adoption across diverse applications, including smartphones, wearable devices, and AR/VR products, thanks to its superior pixel density and outstanding image quality.
The growing trend toward miniaturization and integration in consumer electronics is further accelerating the market's expansion. As devices become increasingly compact, lightweight, and portable, OLEDoS emerges as an ideal display solution, offering unparalleled performance without compromising quality. Its ultra-thin and compact design is perfectly suited for modern consumer gadgets, where space-saving components are paramount.
| Market Scope | |
|---|---|
| Start Year | 2024 |
| Forecast Year | 2025-2034 |
| Start Value | $540 Million |
| Forecast Value | $11.3 Billion |
| CAGR | 35.6% |
Segmented by light spectrum, the OLED-on-Silicon market encompasses near-infrared, infrared, ultraviolet, multi-spectrum, and others. The multi-spectrum segment is anticipated to reach a valuation of USD 3.4 billion by 2034. Meanwhile, the visible spectrum segment is set to dominate the market, driven by its extensive use in high-resolution displays for virtual and augmented reality devices, as well as consumer electronics. These displays deliver superior brightness, color accuracy, and visual performance, meeting the needs of industries such as gaming, automotive, and healthcare, where vibrant and detailed visuals are critical.
In terms of application, the market is divided into display systems, sensing and detection, imaging and inspection, optical communication, and others. Among these, the imaging and inspection segment is poised for impressive growth, projected to achieve a CAGR of 38.8% through 2034, making it the fastest-growing category. Display systems, however, continue to hold a significant share of the market, fueled by the rising demand for energy-efficient and high-performance displays in consumer electronics and AR/VR devices. OLEDoS technology distinguishes itself by delivering rich colors, enhanced brightness, and low power consumption, making it the go-to solution for compact and high-resolution display systems.
The U.S. OLED-on-Silicon market claimed an impressive 82.1% share in 2024, underscoring its dominant position. This leadership is bolstered by strong demand for state-of-the-art consumer electronics and AR/VR devices. Robust investments in research and development, coupled with government initiatives supporting sustainable and energy-efficient technologies, are further driving the adoption of OLEDoS in the U.S., solidifying its status as a key player in the global market.
Table of Contents
Chapter 1 Methodology & Scope
- 1.1 Market scope & definitions
- 1.2 Base estimates & calculations
- 1.3 Forecast calculations
- 1.4 Data sources
- 1.4.1 Primary
- 1.4.2 Secondary
- 1.4.2.1 Paid sources
- 1.4.2.2 Public sources
Chapter 2 Executive Summary
- 2.1 Industry synopsis, 2021-2034
Chapter 3 Industry Insights
- 3.1 Industry ecosystem analysis
- 3.1.1 Factor affecting the value chain
- 3.1.2 Profit margin analysis
- 3.1.3 Disruptions
- 3.1.4 Future outlook
- 3.1.5 Manufacturers
- 3.1.6 Distributors
- 3.2 Supplier landscape
- 3.3 Profit margin analysis
- 3.4 Key news & initiatives
- 3.5 Regulatory landscape
- 3.6 Impact forces
- 3.6.1 Growth drivers
- 3.6.1.1 Rising demand for high-resolution displays
- 3.6.1.2 Miniaturization and integration in consumer electronics
- 3.6.1.3 Enhanced performance and cost efficiency
- 3.6.1.4 Advancements in flexible and transparent display technologies
- 3.6.1.5 Support from industry leaders and technological partnerships
- 3.6.2 Industry pitfalls & challenges
- 3.6.2.1 High manufacturing costs and complexity
- 3.6.2.2 Limited market penetration and consumer awareness
- 3.6.1 Growth drivers
- 3.7 Growth potential analysis
- 3.8 Porter’s analysis
- 3.9 PESTEL analysis
Chapter 4 Competitive Landscape, 2024
- 4.1 Introduction
- 4.2 Company market share analysis
- 4.3 Competitive positioning matrix
- 4.4 Strategic outlook matrix
Chapter 5 Market Estimates & Forecast, By Light Spectrum, 2021-2034 (USD Billion) (Units)
- 5.1 Key trends
- 5.2 Visible spectrum (RGB, Full-Color Displays)
- 5.3 Near-infrared (NIR, 700-1400 nm)
- 5.4 Infrared (IR, 700-3000 nm)
- 5.5 Ultraviolet (UV, <400 nm)
- 5.6 Multi-spectrum (Visible + IR + NIR)
- 5.7 Others
Chapter 6 Market Estimates & Forecast, By Application, 2021-2034 (USD Billion) (Units)
- 6.1 Key trends
- 6.2 Display systems
- 6.3 Sensing & detection
- 6.4 Imaging & inspection
- 6.5 Optical communication
- 6.6 Others
Chapter 7 Market Estimates & Forecast, By End Use, 2021-2034 (USD Billion) (Units)
- 7.1 Key trends
- 7.2 Aerospace & defense
- 7.3 Consumer electronics
- 7.4 Industrial & manufacturing
- 7.5 Healthcare & medical
- 7.6 Automotive
- 7.7 Others
Chapter 8 Market Estimates & Forecast, By Region, 2021-2034 (USD Billion) (Units)
- 8.1 Key trends
- 8.2 North America
- 8.2.1 U.S.
- 8.2.2 Canada
- 8.3 Europe
- 8.3.1 UK
- 8.3.2 Germany
- 8.3.3 France
- 8.3.4 Italy
- 8.3.5 Spain
- 8.3.6 Russia
- 8.4 Asia Pacific
- 8.4.1 China
- 8.4.2 India
- 8.4.3 Japan
- 8.4.4 South Korea
- 8.4.5 Australia
- 8.5 Latin America
- 8.5.1 Brazil
- 8.5.2 Mexico
- 8.6 MEA
- 8.6.1 South Africa
- 8.6.2 Saudi Arabia
- 8.6.3 UAE
Chapter 9 Company Profiles
- 9.1 China Star Optoelectronics Technology (CSOT)
- 9.2 eMagin Corporation
- 9.3 Himax Technologies, Inc.
- 9.4 HOLOEYE Photonics AG
- 9.5 Innolux Corporation
- 9.6 JDI (Japan Display Inc.)
- 9.7 Kopin Corporation
- 9.8 LG Display Co., Ltd.
- 9.9 Olightek
- 9.10 Pixelligent Technologies LLC
- 9.11 Raystar Optronics Inc.
- 9.12 Ritek Corporation
- 9.13 Samsung Electronics Co., Ltd.
- 9.14 SeeYA Technology
- 9.15 SiliconCore Technology Inc.
- 9.16 Sony Corporation
- 9.17 Tridonic GmbH & Co. KG
- 9.18 Visionox
- 9.19 Winstar Display Co., Ltd.
- 9.20 WiseChip Semiconductor Inc.

