
|
市場調査レポート
商品コード
1665345
自動視野計の市場機会、成長促進要因、産業動向分析、2025年~2034年予測Automated Visual Field Analyzer Market Opportunity, Growth Drivers, Industry Trend Analysis, and Forecast 2025 - 2034 |
||||||
カスタマイズ可能
|
|||||||
| 自動視野計の市場機会、成長促進要因、産業動向分析、2025年~2034年予測 |
|
出版日: 2024年12月23日
発行: Global Market Insights Inc.
ページ情報: 英文 120 Pages
納期: 2~3営業日
|

全表示
- 概要
- 目次
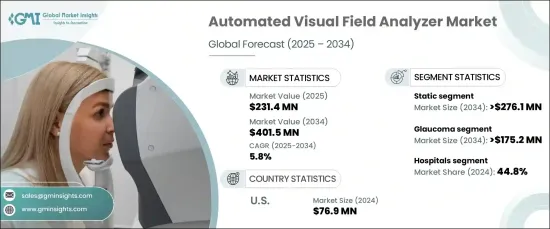
自動視野計の世界市場は2024年に2億3,140万米ドルに達し、2025~2034年にかけてCAGR 5.8%で成長すると予測されています。
この成長軌道は、技術の進歩、眼科疾患の罹患率の上昇、早期診断が視力の維持に果たす重要な役割に対する意識の高まりによって後押しされています。自動視野計は現代の眼科医療に不可欠なものとなっており、視力障害の検出とモニタリングを驚くほど正確に補助しています。
技術革新、特に人工知能と機械学習の統合は、自動視野計の効率と精度を大幅に向上させました。これらの進歩は、より迅速で正確な結果を可能にし、病院や専門の眼科クリニックにおける最先端の診断ツールに対する需要の高まりに応えています。さらに、ユーザーフレンドリーなインターフェースと強化された検査機能は、多様な臨床環境での幅広い採用を促進し、現代の眼科医療におけるこれらの機器の役割を確固たるものにしています。
| 市場範囲 | |
|---|---|
| 開始年 | 2024年 |
| 予測年 | 2025~2034年 |
| 開始金額 | 2億3,140万米ドル |
| 予測金額 | 4億150万米ドル |
| CAGR | 5.8% |
市場は製品タイプ別に静的分析装置と動的分析装置に区分されます。静的分析装置は着実な成長が見込まれ、CAGRは5.5%で、2034年には2億7,610万米ドルに達すると予測されます。これらの装置は、患者の視野内の固定点を評価し、視覚障害の早期発見に不可欠な高精度で再現性の高いデータを記載しています。その信頼性と使いやすさから、臨床診断や研究用途の最有力候補となっています。特に高齢化社会の中で、世界の視力喪失の主要原因である緑内障の有病率の増加が、このセグメントの成長をさらに後押ししています。
用途別では、緑内障、加齢黄斑変性(AMD)、神経疾患、その他の用途があります。緑内障セグメントはCAGR 6.3%で堅調に成長し、2034年までに1億7,520万米ドルを創出すると予想されています。糖尿病や高血圧などの危険因子によって緑内障の症例が増加しており、先進的診断ツールの必要性が強調されています。自動視野計は、緑内障の進行の検出とモニタリングに優れており、早期介入の機会を提供し、不可逆的な視野喪失のリスクを低減します。
米国の自動視野計市場は、2024年に7,690万米ドルと評価され、2034年までCAGR 4.8%で成長すると予測されています。この成長の原動力は、緑内障、AMD、糖尿病性網膜症などの視覚関連疾患の有病率の増加です。これらの疾患への罹患率が高い高齢化により、定期的な眼科検査と先進的診断技術の必要性が高まっています。継続的な技術革新、特にAIとMLの採用は、診断精度と効率を高め続け、米国の医療状況全体におけるこれらの機器の採用に拍車をかけています。
目次
第1章 調査手法と調査範囲
第2章 エグゼクティブサマリー
第3章 産業洞察
- エコシステム分析
- 産業への影響要因
- 促進要因
- 緑内障とその他の眼疾患の有病率の上昇
- 早期診断への注目の高まり
- 神経学的評価への採用
- 外来眼科医療に対する需要の高まり
- 産業の潜在的リスク・課題
- 装置の高コスト
- 促進要因
- 成長可能性分析
- 規制状況
- 償還シナリオ
- 技術
- ギャップ分析
- ポーター分析
- PESTEL分析
- 今後の市場動向
第4章 競合情勢
- イントロダクション
- 企業マトリックス分析
- 企業シェア分析
- 主要市場企業の競合分析
- 競合のポジショニングマトリックス
- 戦略ダッシュボード
第5章 市場推定・予測:製品タイプ別、2021~2034年
- 主要動向
- 静的
- 動的
第6章 市場推定・予測:用途別、2021~2034年
- 主要動向
- 緑内障
- 加齢黄斑変性(AMD)
- 神経疾患
- その他
第7章 市場推定・予測:最終用途別、2021~2034年
- 主要動向
- 病院
- 眼科クリニック
- その他
第8章 市場推定・予測:地域別、2021~2034年
- 主要動向
- 北米
- 米国
- カナダ
- 欧州
- ドイツ
- 英国
- フランス
- スペイン
- イタリア
- オランダ
- アジア太平洋
- 中国
- 日本
- インド
- オーストラリア
- 韓国
- ラテンアメリカ
- ブラジル
- メキシコ
- アルゼンチン
- 中東・アフリカ
- 南アフリカ
- サウジアラビア
- アラブ首長国連邦
第9章 企業プロファイル
- Canon
- ESSILOR INSTRUMENTS
- HAAG-STREIT GROUP
- HEIDELBERG ENGINEERING
- Konan Medical
- Kowa
- MEDA
- Metrovision
- OCULUS
- Optopol
- Reichert AMETEK
- Rexxam
- TOPCON Healthcare
- Zeiss
The Global Automated Visual Field Analyzer Market reached USD 231.4 million in 2024 and is projected to grow at a CAGR of 5.8% between 2025 and 2034. This growth trajectory is fueled by technological advancements, a rising incidence of ophthalmic disorders, and increasing awareness of the critical role early diagnosis plays in preserving vision. Automated visual field analyzers have become indispensable in modern ophthalmology, aiding in the detection and monitoring of vision impairments with remarkable accuracy.
Technological innovations, particularly the integration of artificial intelligence and machine learning, have significantly enhanced the efficiency and precision of automated visual field analyzers. These advancements enable faster, more accurate results, meeting the growing demand for cutting-edge diagnostic tools in hospitals and specialized eye clinics. Additionally, user-friendly interfaces and enhanced testing capabilities have driven widespread adoption across diverse clinical environments, solidifying the role of these devices in modern eye care.
| Market Scope | |
|---|---|
| Start Year | 2024 |
| Forecast Year | 2025-2034 |
| Start Value | $231.4 Million |
| Forecast Value | $ 401.5 Million |
| CAGR | 5.8% |
The market is segmented by product type into static and kinetic analyzers. Static analyzers are set to witness steady growth, with a projected CAGR of 5.5%, reaching USD 276.1 million by 2034. These devices evaluate fixed points within a patient's visual field, offering highly accurate and reproducible data crucial for the early detection of visual impairments. Their reliability and ease of use make them a top choice for clinical diagnostics and research applications. The segment growth is further bolstered by the increasing prevalence of glaucoma, a leading cause of vision loss worldwide, particularly among aging populations.
By application, the market encompasses glaucoma, age-related macular degeneration (AMD), neurological disorders, and other uses. The glaucoma segment is expected to grow at a robust CAGR of 6.3%, generating USD 175.2 million by 2034. Rising cases of glaucoma, driven by risk factors such as diabetes and hypertension, underscore the need for advanced diagnostic tools. Automated visual field analyzers excel in detecting and monitoring glaucoma progression, providing opportunities for early intervention and reducing the risk of irreversible vision loss.
The U.S. market for automated visual field analyzers, valued at USD 76.9 million in 2024, is anticipated to grow at a CAGR of 4.8% through 2034. This growth is driven by the increasing prevalence of vision-related disorders, including glaucoma, AMD, and diabetic retinopathy. An aging population with a higher susceptibility to these conditions amplifies the need for regular eye examinations and advanced diagnostic technologies. Ongoing innovation, particularly the adoption of AI and ML, continues to enhance diagnostic accuracy and efficiency, fueling the adoption of these devices across the U.S. healthcare landscape.
Table of Contents
Chapter 1 Methodology and Scope
- 1.1 Market scope and definitions
- 1.2 Research design
- 1.2.1 Research approach
- 1.2.2 Data collection methods
- 1.3 Base estimates and calculations
- 1.3.1 Base year calculation
- 1.3.2 Key trends for market estimation
- 1.4 Forecast model
- 1.5 Primary research and validation
- 1.5.1 Primary sources
- 1.5.2 Data mining sources
Chapter 2 Executive Summary
- 2.1 Industry 3600 synopsis
Chapter 3 Industry Insights
- 3.1 Industry ecosystem analysis
- 3.2 Industry impact forces
- 3.2.1 Growth drivers
- 3.2.1.1 Rising prevalence of glaucoma and other eye disorders
- 3.2.1.2 Increased focus on early diagnosis
- 3.2.1.3 Adoption in neurological assessments
- 3.2.1.4 Rising demand for outpatient eye care
- 3.2.2 Industry pitfalls and challenges
- 3.2.2.1 High cost of devices
- 3.2.1 Growth drivers
- 3.3 Growth potential analysis
- 3.4 Regulatory landscape
- 3.5 Reimbursement scenario
- 3.6 Technology landscape
- 3.7 Gap analysis
- 3.8 Porter's analysis
- 3.9 PESTEL analysis
- 3.10 Future market trends
Chapter 4 Competitive Landscape, 2024
- 4.1 Introduction
- 4.2 Company matrix analysis
- 4.3 Company market share analysis
- 4.4 Competitive analysis of major market players
- 4.5 Competitive positioning matrix
- 4.6 Strategy dashboard
Chapter 5 Market Estimates and Forecast, By Product Type, 2021 – 2034 ($ Mn)
- 5.1 Key trends
- 5.2 Static
- 5.3 Kinetic
Chapter 6 Market Estimates and Forecast, By Application, 2021 – 2034 ($ Mn)
- 6.1 Key trends
- 6.2 Glaucoma
- 6.3 Age-related macular degeneration (AMD)
- 6.4 Neurological disorders
- 6.5 Other applications
Chapter 7 Market Estimates and Forecast, By End Use, 2021 – 2034 ($ Mn)
- 7.1 Key trends
- 7.2 Hospitals
- 7.3 Ophthalmic clinics
- 7.4 Other end users
Chapter 8 Market Estimates and Forecast, By Region, 2021 – 2034 ($ Mn)
- 8.1 Key trends
- 8.2 North America
- 8.2.1 U.S.
- 8.2.2 Canada
- 8.3 Europe
- 8.3.1 Germany
- 8.3.2 UK
- 8.3.3 France
- 8.3.4 Spain
- 8.3.5 Italy
- 8.3.6 Netherlands
- 8.4 Asia Pacific
- 8.4.1 China
- 8.4.2 Japan
- 8.4.3 India
- 8.4.4 Australia
- 8.4.5 South Korea
- 8.5 Latin America
- 8.5.1 Brazil
- 8.5.2 Mexico
- 8.5.3 Argentina
- 8.6 Middle East and Africa
- 8.6.1 South Africa
- 8.6.2 Saudi Arabia
- 8.6.3 UAE
Chapter 9 Company Profiles
- 9.1 Canon
- 9.2 ESSILOR INSTRUMENTS
- 9.3 HAAG-STREIT GROUP
- 9.4 HEIDELBERG ENGINEERING
- 9.5 Konan Medical
- 9.6 Kowa
- 9.7 MEDA
- 9.8 Metrovision
- 9.9 OCULUS
- 9.10 Optopol
- 9.11 Reichert AMETEK
- 9.12 Rexxam
- 9.13 TOPCON Healthcare
- 9.14 Zeiss
