
|
市場調査レポート
商品コード
1665043
液体充填機市場の機会、成長促進要因、産業動向分析、2024年~2032の年予測Liquid Filling Machines Market Opportunity, Growth Drivers, Industry Trend Analysis, and Forecast 2024 - 2032 |
||||||
カスタマイズ可能
|
|||||||
| 液体充填機市場の機会、成長促進要因、産業動向分析、2024年~2032の年予測 |
|
出版日: 2024年12月10日
発行: Global Market Insights Inc.
ページ情報: 英文 220 Pages
納期: 2~3営業日
|

全表示
- 概要
- 目次
液体充填機の世界市場は、2023年に87億米ドルの評価額を達成し、2024年から2032年にかけてCAGR 7.6%で力強い成長を遂げようとしています。
ダイナミックな包装機械産業において、液体充填機は医薬品、飲食品、化粧品、化学品など幅広い産業に貢献しています。これらの機械は、液体製品をボトル、缶、パウチ、ジャーなどの容器に移すプロセスを合理化し、水やジュースからオイル、シロップ、クリーム、化学薬品などの粘度の高い物質まで、さまざまな粘度の液体に対応します。
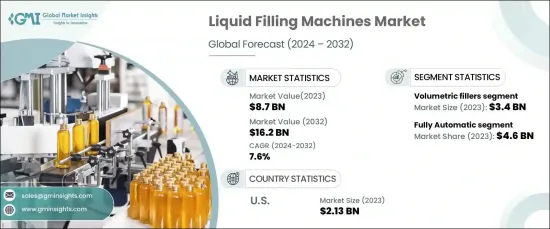
市場セグメンテーションは、機械タイプ別に分けると、ロータリー充填機、無菌充填機、容積充填機、正味重量充填機、その他の特殊充填機があります。容積式充填機セグメントは、2023年に34億米ドルと評価され、予測期間を通じてCAGR 7.1%で拡大すると予測されています。この分野は、比類のない汎用性と費用対効果により市場を独占しており、水、ジュース、ソースなどの非炭酸飲料の充填に特に人気があります。
| 市場範囲 | |
|---|---|
| 開始年 | 2023 |
| 予測年 | 2024-2032 |
| 開始金額 | 87億米ドル |
| 予測金額 | 162億米ドル |
| CAGR | 7.6% |
市場はまた、自動化のレベルに基づいて分類され、手動、半自動、全自動機が含まれます。全自動液体充填機は2023年に54%の市場シェアを占め、2032年には46億米ドルに達すると予測されます。これらの機械は、その卓越したスピード、精度、信頼性から高い人気を誇り、大規模な産業アプリケーションに最適な選択肢となっています。IoTや高度な自動化システムなどの最先端技術との統合は、その効率をさらに高め、生産性と拡張性の向上を目指すメーカーに対応しています。
米国の液体充填機市場だけでも、2023年の市場規模は21億3,000万米ドルで、2024年から2032年にかけてCAGR 6.5%で成長すると予測されています。この成長の原動力は、同国の強固な産業インフラと、医薬品、飲食品、化学品などの盛んなセクターの存在です。自動化技術の高い採用率は、FDAのような機関によって施行される厳しい規制基準と相まって、特に医薬品・栄養補助食品業界において、精密で準拠性の高い充填システムの需要を牽引しています。
目次
第1章 調査手法と調査範囲
- 市場範囲と定義
- 基本推定と計算
- 予測計算
- データソース
- 1次データ
- 2次データ
- 有料情報源
- 公的情報源
第2章 エグゼクティブサマリー
第3章 業界洞察
- エコシステム分析
- バリューチェーンに影響を与える要因
- 利益率分析
- 破壊
- 将来の展望
- メーカー
- 流通業者
- サプライヤーの状況
- 利益率分析
- 主要ニュース
- 規制状況
- 影響要因
- 促進要因
- 包装液体に対する需要の高まり
- 自動化技術の進歩
- 規制基準の強化と品質管理
- 業界の潜在的リスク&課題
- 高い初期資本投資
- 多様な液体タイプの取り扱いの複雑さ
- 促進要因
- 成長可能性分析
- ポーターの分析
- PESTEL分析
第4章 競合情勢
- イントロダクション
- 企業シェア分析
- 競合のポジショニング・マトリックス
- 戦略展望マトリックス
第5章 市場推計・予測:マシンタイプ別、2021年~2032年
- 主要動向
- ロータリー充填機
- 無菌充填機
- 容積式充填機
- 正味重量充填機
- その他
第6章 市場推計・予測:自動化レベル別、2021年~2032年
- 主要動向
- 手動
- 半自動
- 全自動
第7章 市場推計・予測:充填タイプ別、2021年~2032年
- 主要動向
- 高温充填
- 低温充填
- 無菌充填
第8章 市場推計・予測:容器別、2021年~2032年
- 主要動向
- プラスチック
- ガラス
- 金属
第9章 市場推計・予測:産業別、2021年~2032年
- 主要動向
- 医薬品
- 飲食品
- 化学
- 化粧品・パーソナルケア
- その他
第10章 市場推計・予測:販売チャネル別、2021年~2032年
- 主要動向
- 直接販売
- 間接販売
第11章 市場推計・予測:地域別、2021年~2032年
- 主要動向
- 北米
- 米国
- カナダ
- 欧州
- 英国
- ドイツ
- フランス
- イタリア
- スペイン
- ロシア
- アジア太平洋
- 中国
- インド
- 日本
- 韓国
- オーストラリア
- ラテンアメリカ
- ブラジル
- メキシコ
- 中東・アフリカ
- UAE
- サウジアラビア
- 南アフリカ
第12章 企業プロファイル
- Krones
- GEA Group
- Tetra Pak International
- KHS
- JBT Corporation
- Sidel Group
- Coesia
- ProMach
- Serac Group
- Ronchi Mario
- Trepko Group
- Weightpack
- Inline Filling Systems
- E-PAK Machinery
The Global Liquid Filling Machines Market achieved a valuation of USD 8.7 billion in 2023 and is poised for robust growth at a CAGR of 7.6% from 2024 to 2032. Operating within the dynamic packaging machinery industry, liquid filling machines serve a broad spectrum of industries, including pharmaceuticals, food and beverage, cosmetics, and chemicals. These machines streamline the process of transferring liquid products into containers such as bottles, cans, pouches, and jars, catering to liquids of various viscosities-from water and juices to thicker substances like oils, syrups, creams, and chemicals.
Market segmentation by machine type includes rotary fillers, aseptic fillers, volumetric fillers, net weight fillers, and other specialized fillers. The volumetric fillers segment, valued at USD 3.4 billion in 2023, is anticipated to expand at a CAGR of 7.1% through the forecast period. This segment dominates the market due to its unparalleled versatility and cost-effectiveness, making it particularly popular for filling non-carbonated beverages like water, juices, and sauces.
| Market Scope | |
|---|---|
| Start Year | 2023 |
| Forecast Year | 2024-2032 |
| Start Value | $8.7 Billion |
| Forecast Value | $16.2 Billion |
| CAGR | 7.6% |
The market is also classified based on the level of automation, encompassing manual, semi-automatic, and fully automatic machines. Fully automatic liquid filling machines commanded a 54% market share in 2023 and are projected to reach USD 4.6 billion by 2032. These machines are highly sought after for their exceptional speed, precision, and reliability, making them the go-to choice for large-scale industrial applications. Integration with cutting-edge technologies, such as IoT and advanced automation systems, further elevates their efficiency, catering to manufacturers aiming to enhance productivity and scalability.
The U.S. liquid filling machines market alone was valued at USD 2.13 billion in 2023 and is projected to grow at a CAGR of 6.5% from 2024 to 2032. This growth is fueled by the country's robust industrial infrastructure and the significant presence of thriving sectors like pharmaceuticals, food and beverage, and chemicals. High adoption of automation technologies, coupled with stringent regulatory standards enforced by agencies like the FDA, drives the demand for precise and compliant filling systems, particularly within the pharmaceutical and nutraceutical industries.
Table of Contents
Chapter 1 Methodology & Scope
- 1.1 Market scope & definition
- 1.2 Base estimates & calculations
- 1.3 Forecast calculations
- 1.4 Data sources
- 1.4.1 Primary
- 1.4.2 Secondary
- 1.4.2.1 Paid sources
- 1.4.2.2 Public sources
Chapter 2 Executive Summary
- 2.1 Industry synopsis, 2021-2032
Chapter 3 Industry Insights
- 3.1 Industry ecosystem analysis
- 3.1.1 Factor affecting the value chain
- 3.1.2 Profit margin analysis
- 3.1.3 Disruptions
- 3.1.4 Future outlook
- 3.1.5 Manufacturers
- 3.1.6 Distributors
- 3.2 Supplier landscape
- 3.3 Profit margin analysis
- 3.4 Key news & initiatives
- 3.5 Regulatory landscape
- 3.6 Impact forces
- 3.6.1 Growth drivers
- 3.6.1.1 Rising demand for packaged liquids
- 3.6.1.2 Technological advancements in automation
- 3.6.1.3 Increasing regulatory standards and quality control
- 3.6.2 Industry pitfalls & challenges
- 3.6.2.1 High initial capital investment
- 3.6.2.2 Complexity in handling diverse liquid types
- 3.6.1 Growth drivers
- 3.7 Growth potential analysis
- 3.8 Porter’s analysis
- 3.9 PESTEL analysis
Chapter 4 Competitive Landscape, 2023
- 4.1 Introduction
- 4.2 Company market share analysis
- 4.3 Competitive positioning matrix
- 4.4 Strategic outlook matrix
Chapter 5 Market Estimates & Forecast, By Machine Type, 2021-2032 (USD Billion) (Thousand Units)
- 5.1 Key trends
- 5.2 Rotary fillers
- 5.3 Aseptic fillers
- 5.4 Volumetric fillers
- 5.5 Net weight fillers
- 5.6 Others
Chapter 6 Market Estimates & Forecast, By Automation Level, 2021-2032 (USD Billion) (Thousand Units)
- 6.1 Key trends
- 6.2 Manual
- 6.3 Semi-automatic
- 6.4 Fully automatic
Chapter 7 Market Estimates & Forecast, By Fill Type, 2021-2032 (USD Billion) (Thousand Units)
- 7.1 Key trends
- 7.2 Hot fill
- 7.3 Cold fill
- 7.4 Aseptic fill
Chapter 8 Market Estimates & Forecast, By Container, 2021-2032 (USD Billion) (Thousand Units)
- 8.1 Key trends
- 8.2 Plastic
- 8.3 Glass
- 8.4 Metal
Chapter 9 Market Estimates & Forecast, By Industry, 2021-2032 (USD Billion) (Thousand Units)
- 9.1 Key trends
- 9.2 Pharmaceutical
- 9.3 Food & beverage
- 9.4 Chemical
- 9.5 Cosmetics and personal care
- 9.6 Others
Chapter 10 Market Estimates & Forecast, By Sales Channel, 2021-2032 (USD Billion) (Thousand Units)
- 10.1 Key trends
- 10.2 Direct sales
- 10.3 Indirect sales
Chapter 11 Market Estimates & Forecast, By Region, 2021-2032 (USD Billion) (Thousand Units)
- 11.1 Key trends
- 11.2 North America
- 11.2.1 U.S.
- 11.2.2 Canada
- 11.3 Europe
- 11.3.1 UK
- 11.3.2 Germany
- 11.3.3 France
- 11.3.4 Italy
- 11.3.5 Spain
- 11.3.6 Russia
- 11.4 Asia Pacific
- 11.4.1 China
- 11.4.2 India
- 11.4.3 Japan
- 11.4.4 South Korea
- 11.4.5 Australia
- 11.5 Latin America
- 11.5.1 Brazil
- 11.5.2 Mexico
- 11.6 MEA
- 11.6.1 UAE
- 11.6.2 Saudi Arabia
- 11.6.3 South Africa
Chapter 12 Company Profiles
- 12.1 Krones
- 12.2 GEA Group
- 12.3 Tetra Pak International
- 12.4 KHS
- 12.5 JBT Corporation
- 12.6 Sidel Group
- 12.7 Coesia
- 12.8 ProMach
- 12.9 Serac Group
- 12.10 Ronchi Mario
- 12.11 Trepko Group
- 12.12 Weightpack
- 12.13 Inline Filling Systems
- 12.14 E-PAK Machinery
