
|
市場調査レポート
商品コード
1892894
電動トランスポーター市場の機会、成長要因、業界動向分析、および2026年から2035年までの予測Electric Transporters Market Opportunity, Growth Drivers, Industry Trend Analysis, and Forecast 2026 - 2035 |
||||||
カスタマイズ可能
|
|||||||
| 電動トランスポーター市場の機会、成長要因、業界動向分析、および2026年から2035年までの予測 |
|
出版日: 2025年12月05日
発行: Global Market Insights Inc.
ページ情報: 英文 225 Pages
納期: 2~3営業日
|

概要
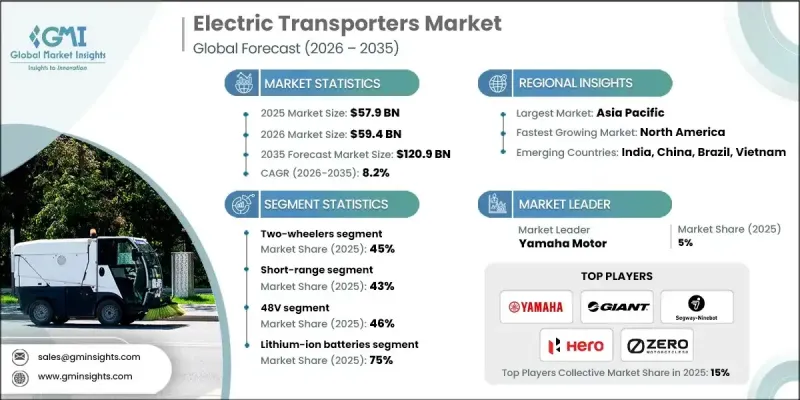
世界の電動トランスポーター市場は、2025年に579億米ドルと評価され、2035年までにCAGR8.2%で成長し、1,209億米ドルに達すると予測されています。
燃料費の高騰と従来型エネルギー市場の継続的な不安定化により、企業は着実に電動モビリティへ移行しています。原油価格が1バレルあたり80米ドルに近づき、さらに5米ドルの上昇が見込まれる中、電動トランスポーターは燃料費とメンテナンス需要の両方を削減する費用対効果の高い代替手段となりつつあります。特に電力料金が安定している地域や再生可能エネルギーへのアクセスが良好な地域では、これらの車両の総所有コスト(TCO)がますます有利な選択肢となっています。主要都市における急速な人口増加は都市道路網への負担を継続的に増加させており、10億人以上が依然として信頼性の高い全天候型道路を欠いています。交通渋滞が悪化する中、コンパクトな電動トランスポーターの需要が高まっています。拡大する電子商取引はラストマイル配送に用いられる電気貨物輸送車両の需要を加速させており、標準化されたデータ形式や通信プロトコルにおける技術的進歩がプラットフォーム間の相互運用性を向上させています。規制の明確化が進み、安全性や互換性を強化する世界の取り組みも、消費者向けおよび商業向けの使用事例における普及を加速させる一助となっております。
| 市場範囲 | |
|---|---|
| 開始年 | 2025年 |
| 予測年度 | 2026-2035 |
| 開始時価値 | 579億米ドル |
| 予測金額 | 1,209億米ドル |
| CAGR | 8.2% |
二輪車セグメントは2025年に45%のシェアを占め、2026年から2035年にかけてCAGR 8.5%で成長すると予測されています。このセグメントは、比較的小さなバッテリーシステムを必要とするため電動化を主導しており、業界全体のバッテリーコストが低下し続ける中で競争力のある価格を維持するのに役立っています。
短距離セグメントは2025年に43%のシェアを占め、2035年までに8.6%という最高成長率で拡大すると予測されています。これらの車両は100km未満の日常的な都市部移動を想定して設計されており、既存の充電インフラを活用します。低コスト、軽量設計、機動性、駐車容易性といった特長が、マイクロモビリティやラストマイル配送に注力する通勤者や企業に支持されています。
アジア太平洋地域の電動トランスポーター市場は2025年に73%のシェアを獲得し、2025年から2034年にかけてCAGR 7.8%で成長すると予想されます。中国における活発な生産活動と、インドおよび東南アジア市場での普及拡大が、同地域の優位性を引き続き支えています。中国は世界全体の電動トランスポーター販売台数の約78%を占めており、これは広範な消費者受容、政府主導の施策、大規模な産業基盤によって支えられています。
よくあるご質問
目次
第1章 調査手法
第2章 エグゼクティブサマリー
第3章 業界考察
- エコシステム分析
- サプライヤーの情勢
- 利益率分析
- コスト構造
- 各段階における付加価値
- バリューチェーンに影響を与える要因
- ディスラプション
- 業界への影響要因
- 促進要因
- 都市化と交通渋滞
- 環境問題と規制面での支援
- 電子商取引と物流の成長
- 電池技術の進歩とコストの低下
- 燃料価格の上昇と運営コストの低減
- 業界の潜在的リスク&課題
- 充電インフラの不足と航続距離への不安
- 初期費用の高さと回収期間の長さ
- 市場機会
- ラストマイル配送ソリューションの拡大
- バッテリー交換および急速充電インフラの開発
- スマートシティおよび都市モビリティ構想との統合
- 物流および公共交通におけるフリート電動化
- 技術革新とモジュール式車両設計
- 成長可能性分析
- 規制情勢
- 世界規制概観
- 北米における規制の枠組み
- 欧州の規制枠組み
- アジア太平洋地域の規制枠組み
- ラテンアメリカにおける規制の枠組み
- 中東・アフリカ地域における規制枠組み
- 安全基準と認証
- サイバーセキュリティ及びデータプライバシー規制
- 環境・排出規制
- 規制コンプライアンスコスト分析
- 世界規制概観
- ポーター分析
- PESTEL分析
- 技術とイノベーションの動向
- 現在の技術動向
- バッテリー技術
- 電気モーター技術
- パワーエレクトロニクス及び制御システム
- コネクティビティとテレマティクス
- 充電インフラ
- 新興技術
- 次世代電池技術
- 先進充電技術
- 自動運転およびADAS機能
- 高度な接続性(新興)
- 車両から電力網への技術(V2G)
- 現在の技術動向
- 価格動向
- 地域別
- 製品別
- 生産統計
- 生産拠点
- 消費ハブ
- 輸出と輸入
- 価格分析と市場経済学
- 価格動向の概要
- 車両タイプ別価格設定
- 地域別価格差異
- バッテリーコストが車両価格に与える影響
- 総所有コスト(TCO)分析
- 政府のインセンティブ及び補助金による影響
- 共有マイクロモビリティの価格設定モデル
- 価格弾力性分析
- 将来の価格見通し
- コスト内訳分析
- 製造コスト構造
- 研究開発コスト分析
- 規制遵守コスト
- 流通・物流コスト
- マーケティング及び販売コスト
- 運営コスト(共有モビリティ)
- 充電インフラコスト
- 保証およびアフターセールス費用
- コスト削減ロードマップ
- 特許分析
- 持続可能性と環境的側面
- 持続可能な実践
- 廃棄物削減戦略
- 生産におけるエネルギー効率
- 環境に配慮した取り組み
- カーボンフットプリントに関する考慮事項
- エンドユーザー行動分析
- 消費者の採用パターン
- 利用パターンと移動特性
- 移動手段の選択と代替分析
- 購入決定要因
- シェアードモビリティ利用者の行動特性
- フリート運営者の意思決定
- 交通機関の調達行動
- 安全性の認識とリスク意識
- ブランドロイヤルティと切り替え行動
- 将来の行動動向
- リスク評価・軽減フレームワーク
- 技術リスク
- 規制・コンプライアンスリスク
- サプライチェーンリスク
- 市場・競争リスク
- 財務リスク
- オペレーショナルリスク(共有モビリティ)
- 評判・ブランドリスク
- 環境・気候リスク
- 保険・賠償責任リスク
- リスク優先順位マトリクス
- 将来展望と機会
- 新興技術動向
- 規制の進化と影響
- ビジネスモデルの革新
- 投資機会
- 戦略的提言
- リスク分析と軽減戦略
- シナリオ分析
第4章 競合情勢
- イントロダクション
- 企業の市場シェア分析
- 北米
- 欧州
- アジア太平洋地域
- ラテンアメリカ
- 中東・アフリカ地域
- 主要市場企業の競合分析
- 競合ポジショニングマトリックス
- 戦略的展望マトリックス
- 主な発展
- 合併・買収
- 提携・協業
- 新製品の発売
- 事業拡大計画と資金調達
第5章 市場推計・予測:電気自動車別、2022-2035
- 二輪車
- 電動自転車
- 電動スクーター
- 電動二輪車
- 三輪車
- パーソナルトランスポーター
- スケートボード
- ホバーボード
第6章 市場推計・予測:電圧別、2022-2035
- 24V
- 36V
- 48V
- 48V以上
第7章 市場推計・予測:バッテリー別、2022-2035
- リチウムイオン電池
- 鉛蓄電池
- ニッケル水素電池
- 固体電池
第8章 市場推計・予測:範囲別、2022-2035
- 短距離(都市部、1日あたり100km以下)
- 中距離(地域間、100~300 km/日)
- 長距離(300km/日以上)
第9章 市場推計・予測:用途別、2022-2035
- マイクロモビリティ
- ライドシェアリング
- 貨物輸送
- 公共交通機関
- 個人向けレジャー
- その他
第10章 市場推計・予測:最終用途別、2022-2035
- 個人購入
- 商業企業
- 政府機関および非営利団体向け購買者
- 産業・物流分野
- その他
第11章 市場推計・予測:地域別、2022-2035
- 北米
- 米国
- カナダ
- 欧州
- ドイツ
- 英国
- フランス
- イタリア
- スペイン
- ロシア
- 北欧諸国
- ポルトガル
- クロアチア
- アジア太平洋地域
- 中国
- インド
- 日本
- オーストラリア
- 韓国
- シンガポール
- タイ
- インドネシア
- ベトナム
- ラテンアメリカ
- ブラジル
- メキシコ
- アルゼンチン
- 中東・アフリカ地域
- 南アフリカ
- サウジアラビア
- アラブ首長国連邦
- トルコ
第12章 企業プロファイル
- 世界プレイヤー
- Accell
- Bosch eBike Systems
- BYD Company
- CATL(Contemporary Amperex Technology)
- Energica Motor Company
- NIU Technologies
- Proterra
- Segway Ninebot
- Yadea
- Zero Motorcycles
- 地域プレイヤー
- Giant Manufacturing
- Harley-Davidson
- Nova Bus
- Stromer
- Gazelle
- Tern Bicycles
- Gogoro
- Ather Energy
- Hero Motorcorp
- Piaggio
- Emerging Technology イノベーター
- Lime
- Aventon Bikes
- Tier Mobility
- BMW Motorrad
- Yamaha Motor

