
|
市場調査レポート
商品コード
1928987
交通設備市場の機会、成長要因、業界動向分析、および2026年から2035年までの予測Traffic Equipment Market Opportunity, Growth Drivers, Industry Trend Analysis, and Forecast 2026 - 2035 |
||||||
カスタマイズ可能
|
|||||||
| 交通設備市場の機会、成長要因、業界動向分析、および2026年から2035年までの予測 |
|
出版日: 2026年01月15日
発行: Global Market Insights Inc.
ページ情報: 英文 246 Pages
納期: 2~3営業日
|

概要
世界の交通設備市場は、2025年に133億米ドルと評価され、2035年までにCAGR 6.4%で成長し、242億米ドルに達すると予測されています。
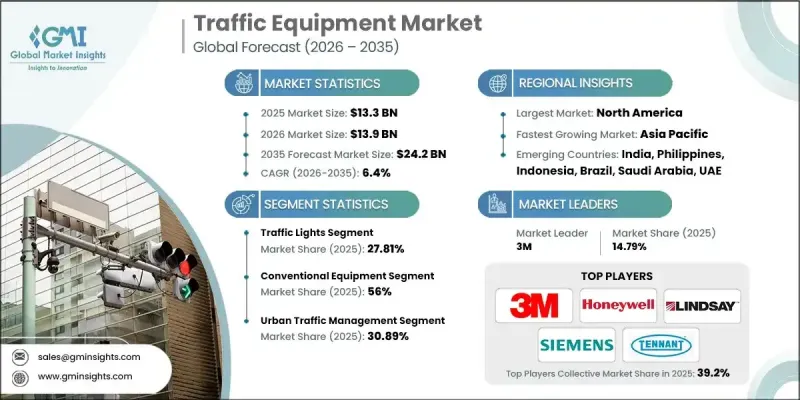
市場拡大は、急速な都市交通の変革、大規模なインフラ整備、そして世界の道路安全管理への注目の高まりによって支えられています。交通設備はもはや基本的な道路脇の設置物に限定されず、相互接続された技術主導型の交通管理ソリューションへと進化を続けています。信号システム、道路標示、バリア、監視ツール、インテリジェント制御ユニットなどの機器は、統合された安全・モビリティネットワークの一部として導入が進んでいます。これらのシステムは、都市道路網、高速道路、工事区域、自治体インフラに加え、応答性と信頼性が極めて重要なスマートシティ開発プログラムにおいても広く採用されています。政府機関や交通当局は、交通流の改善、渋滞の軽減、道路安全性の向上に向け、投資を拡大しています。安全重視の政策とインテリジェント交通イニシアチブにより、旧式設備から先進的で規格準拠のソリューションへの置き換えが加速しています。先進地域では自動化、可視性、データ接続性が重視される一方、発展途上経済圏では基盤となる交通制御インフラの拡充と段階的なデジタル化が引き続き焦点となっています。
| 市場範囲 | |
|---|---|
| 開始年 | 2025年 |
| 予測年度 | 2026-2035 |
| 開始時価値 | 133億米ドル |
| 予測金額 | 242億米ドル |
| CAGR | 6.4% |
信号機セグメントは2025年に27.81%のシェアを占め、2035年までCAGR4.6%で成長すると予測されています。都市化の動向と車両密度の増加により、効率的な交差点および歩行者交通制御への需要が持続しています。現代的な信号システムは、持続可能なモビリティ目標を支援するため、省エネルギー技術や適応機能をますます取り入れています。
従来型機器は2025年に56%のシェアを占め、2026年から2035年にかけてCAGR5.6%で成長すると予想されます。手頃な価格、耐久性、規制順守性、多様な道路環境での導入容易性から、従来の交通制御ソリューションが引き続き主流となっています。
米国交通機器市場は2025年に85.17%のシェアを占め、41億米ドルの収益を生み出しました。交通インフラと道路近代化への継続的な投資が、国内全体で強い需要を持続させています。
よくあるご質問
目次
第1章 調査手法
第2章 エグゼクティブサマリー
第3章 業界考察
- エコシステム分析
- サプライヤーの情勢
- 利益率分析
- コスト構造
- 各段階における付加価値
- バリューチェーンに影響を与える要因
- ディスラプション
- 業界への影響要因
- 促進要因
- 道路インフラ開発への投資増加
- 道路安全と事故削減への注目の高まり
- スマートシティ及び高度交通システム(ITS)の拡大
- 都市化と車両密度の増加
- 業界の潜在的リスク&課題
- 高度な交通システムへの初期投資額が高額であること
- 地域ごとに分断された規制基準
- 市場機会
- スマートかつ接続された交通機器の導入
- 新興経済国におけるインフラ整備の進展
- 官民連携(PPP)プロジェクト
- 促進要因
- 成長可能性分析
- 規制情勢
- 北米
- 連邦高速道路局(FHWA)基準
- 欧州
- ドイツ:交通信号及び道路安全法
- 英国:交通標識規則及び一般指示(TSRGD)
- フランス:モビリティ指向法(LOM法)
- イタリア:国家道路安全・インフラ規制
- アジア太平洋地域
- 中国:スマートシティ及びITSガイドライン
- インド:高度交通管理システムの義務化
- 日本:道路交通法とITS政策
- オーストラリア:州レベルのスマート交通インフラ規制
- ラテンアメリカ
- ブラジル:国家交通安全ガイドライン
- メキシコ:都市道路安全プログラム
- アルゼンチン:州別交通及び道路安全規制
- 中東・アフリカ地域
- アラブ首長国連邦:電気自動車(EV)及びスマートシティ交通規制
- サウジアラビア:道路安全と交通近代化政策
- 南アフリカ:グリーン交通戦略
- 北米
- ポーターの分析
- PESTEL分析
- 生産統計
- 生産拠点
- 消費拠点
- 輸出入
- 技術とイノベーションの動向
- 現在の技術動向
- 新興技術
- 特許分析
- 価格分析
- 地域別
- 製品別
- コスト内訳分析
- 持続可能性と環境影響分析
- 持続可能な取り組み
- 廃棄物削減戦略
- 生産におけるエネルギー効率
- 環境に配慮した取り組み
- カーボンフットプリントに関する考慮事項
- 将来展望と機会
第4章 競合情勢
- イントロダクション
- 企業の市場シェア分析
- 主要市場企業の競合分析
- 競合ポジショニングマトリックス
- 戦略的展望マトリックス
- 主な発展
- 合併・買収
- 提携・協業
- 新製品の発売
- 事業拡大計画と資金調達
第5章 市場推計・予測:製品別、2022-2035
- 信号機
- 交通安全標識
- 交通遮断機
- 交通コーン
- 交通管理ゲート
- その他
第6章 市場推計・予測:用途別、2022-2035
- 都市交通管理
- 高速道路管理
- 駐車場管理
- 作業区域の安全対策
- その他
第7章 市場推計・予測:技術別、2022-2035
- 従来型設備
- スマート/コネクテッド機器
第8章 市場推計・予測:最終用途別、2022-2035
- 政府・自治体
- 民間請負業者
- 運輸機関
第9章 市場推計・予測:地域別、2022-2035
- 北米
- 米国
- カナダ
- 欧州
- ドイツ
- 英国
- フランス
- イタリア
- スペイン
- ロシア
- 北欧諸国
- アジア太平洋地域
- 中国
- インド
- 日本
- オーストラリア
- 韓国
- フィリピン
- インドネシア
- ラテンアメリカ
- ブラジル
- メキシコ
- アルゼンチン
- 中東・アフリカ地域
- 南アフリカ
- サウジアラビア
- アラブ首長国連邦
第10章 企業プロファイル
- 世界企業
- 3 M
- Econolite
- Honeywell
- Iteris
- Jenoptik
- Kapsch TrafficCom
- Lindsay
- Siemens
- SWARCO
- TrafFix Devices
- 地域プレイヤー
- Cortina Safety Products
- Dicke Safety Products
- Eagle Manufacturing
- HSS Hire
- JSP Safety
- Melba Swintex
- Oaklands
- Oxford Plastics
- Pexco
- Plasticade
- Road Traffic Solutions
- Seton
- Tennants
- 新興企業
- National Tool Hire Shops
- Work Area Protection

