
|
市場調査レポート
商品コード
1892902
ドックスケジューリングソフトウェア市場の機会、成長要因、業界動向分析、および2026年から2035年までの予測Dock Scheduling Software Market Opportunity, Growth Drivers, Industry Trend Analysis, and Forecast 2026 - 2035 |
||||||
カスタマイズ可能
|
|||||||
| ドックスケジューリングソフトウェア市場の機会、成長要因、業界動向分析、および2026年から2035年までの予測 |
|
出版日: 2025年12月08日
発行: Global Market Insights Inc.
ページ情報: 英文 240 Pages
納期: 2~3営業日
|

概要
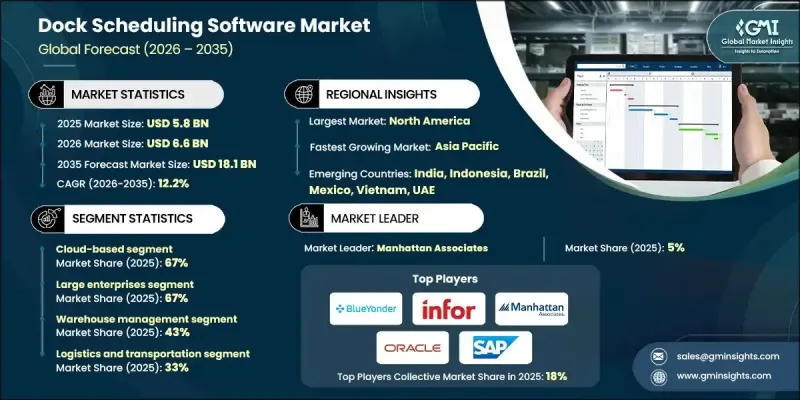
世界のドックスケジューリングソフトウェア市場は、2025年に58億米ドルと評価され、2035年までにCAGR12.2%で成長し、181億米ドルに達すると予測されております。
業務効率化への需要の高まりが導入を促進しており、トラックのドック滞在時間を最小化することは、コスト削減とターンアラウンドタイム短縮に不可欠です。ドックスケジューリングソフトウェアは、企業のドア使用の最適化と予約手配を可能にし、小売、食料品、電子商取引セクターにおける大量輸送を扱う運送業者のアイドル時間を削減し、サービスレベルを向上させます。人手不足と採用コストの上昇により、倉庫では人員配置をより戦略的に行う必要が生じています。スケジューリングソフトウェアは、予想される出荷量に基づいて人員要件を予測し、最も混雑するドックに従業員を割り当てます。さらに、規制順守と業界の安全基準をサポートし、ドライバーの勤務時間を追跡し、違反を報告し、運転時間の規制への順守を確保しながら、ドライバーの安全と業務効率を維持します。
| 市場範囲 | |
|---|---|
| 開始年 | 2025年 |
| 予測年度 | 2026-2035 |
| 開始時価値 | 58億米ドル |
| 予測金額 | 181億米ドル |
| CAGR | 12.2% |
クラウドベースのセグメントは2025年に67%のシェアを占め、2035年までCAGR 12.5%で成長すると予測されています。クラウド導入により、SaaSサブスクリプションモデルを通じてリアルタイムの運送会社統合、モバイルアクセス、初期費用の削減が可能となり、IT管理負担も軽減されます。
大企業セグメントは、広範な倉庫ネットワーク、複数のドックドア、複雑な複数運送業者との連携業務を背景に、2025年に67%の市場シェアを占めました。これらの企業は、AIを活用した最適化、複数拠点の可視化、WMS(倉庫管理システム)およびTMS(輸送管理システム)との深い連携により、地域および全国の流通センターにおいて一貫したプロセスを維持しています。
米国のドックスケジューリングソフトウェア市場は2025年に47億6,000万米ドルの規模に達しました。成長の背景には、トラック輸送能力の逼迫、貨物輸送の高速化、滞留時間に対する規制当局の監視強化があります。自動化、IoTデバイス、セルフサービスポータルは、業務の正確性を高め、流通センターにおける製品受入の適時性を向上させます。
よくあるご質問
目次
第1章 調査手法
第2章 エグゼクティブサマリー
第3章 業界考察
- エコシステム分析
- サプライヤーの情勢
- 利益率
- コスト構造
- 各段階における付加価値
- バリューチェーンに影響を与える要因
- ディスラプション
- 業界への影響要因
- 促進要因
- 滞留時間の削減が必要
- 労働力の最適化
- 規制・コンプライアンス上の圧力
- 現代のサプライチェーンの複雑性
- 業界の潜在的リスク&課題
- 統合の複雑性
- 運送業者およびスタッフの採用抵抗
- 市場機会
- 中小企業(SMB)セグメントへの拡大
- 電子商取引(Eコマース)とオムニチャネル物流
- 新興市場(アジア太平洋地域、ラテンアメリカ、中東・アフリカ)
- 自動化とロボティクスの統合
- 促進要因
- 成長可能性分析
- 規制情勢
- 世界
- 安全及び性能基準
- 環境・サステナビリティ規制
- データプライバシー及び越境データ転送
- 輸送・貨物規制
- 業界固有のコンプライアンス
- 北米
- 欧州
- アジア太平洋地域
- ラテンアメリカ
- 中東・アフリカ
- 世界
- ポーター分析
- PESTEL分析
- 技術とイノベーションの動向
- 現在の技術動向
- スケジューリングエンジンと最適化アルゴリズム
- テレマティクス及び到着予定時刻(ETA)フィード
- リアルタイムヤード/トレーラー位置情報
- モバイルドライバーアプリと運送会社向けポータル
- 新興技術
- AIを活用した予測スケジューリングと異常検知
- ヤード・ドックフロー計画のためのデジタルツインとシミュレーション
- ブロックチェーンを活用した予約の追跡可能性と監査証跡
- 自律走行ヤード車両およびロボットによるドックハンドリング
- 現在の技術動向
- 価格分析
- 導入形態別価格設定
- 単位メトリクスに基づく価格設定
- 機能レベル別価格設定
- 専門サービス及び統合コスト
- コスト内訳分析
- ベンダーのコスト構造
- コスト構成要素の導入
- 継続的な運営コスト
- 間接的な顧客コスト
- 特許分析
- 主要ベンダーによる特許権の所有状況
- 実施の自由と知的財産訴訟の動向
- サステナビリティと環境面
- 持続可能な実践
- 廃棄物削減戦略
- 生産におけるエネルギー効率
- 環境に配慮した取り組み
- カーボンフットプリントに関する考慮事項
- リスク評価・軽減フレームワーク
- サプライチェーンリスク
- 財務・経済リスク
- 規制・コンプライアンスリスク
- 業務リスク
- 技術・イノベーションリスク
- エンドユーザー行動と消費分析
- エンドユースセグメンテーションフレームワーク
- 3PLおよび物流プロバイダーの行動とマルチテナントのニーズ
- 小売業および電子商取引の採用パターン
- 製造およびJITユーザーの行動
第4章 競合情勢
- イントロダクション
- 企業の市場シェア分析
- 北米
- 欧州
- アジア太平洋地域
- ラテンアメリカ
- 中東・アフリカ地域
- 主要市場企業の競合分析
- 競合ポジショニングマトリックス
- 戦略的展望マトリックス
- 主な発展
- 合併・買収
- 提携・協業
- 新製品の発売
- 事業拡大計画と資金調達
第5章 市場推計・予測:導入形態別、2022-2035
- クラウドベース
- オンプレミス
- ハイブリッド
第6章 市場推計・予測:企業規模別、2022-2035
- 大企業
- 中小企業
第7章 市場推計・予測:用途別、2022-2035
- 倉庫管理
- 輸送管理
- ヤード管理
- クロスドッキング業務
- その他
第8章 市場推計・予測:ソリューション別、2022-2035
- スタンドアロン型ドックスケジューリングソフトウェア
- 統合サプライチェーン管理ソリューション
- ヤード管理システム(ドックスケジューリング機能付き)
第9章 市場推計・予測:コンポーネント別、2022-2035
- ソフトウェア
- サービス
第10章 市場推計・予測:最終用途別、2022-2035
- 物流・輸送
- 小売業および電子商取引
- 製造業
- 食品・飲料
- 医療・医薬品分野
- 卸売・流通
- その他
第11章 市場推計・予測:地域別、2022-2035
- 北米
- 米国
- カナダ
- 欧州
- ドイツ
- 英国
- フランス
- イタリア
- スペイン
- 北欧諸国
- ロシア
- ポーランド
- ルーマニア
- アジア太平洋地域
- 中国
- インド
- 日本
- 韓国
- ANZ
- ベトナム
- インドネシア
- ラテンアメリカ
- ブラジル
- メキシコ
- アルゼンチン
- 中東・アフリカ地域
- 南アフリカ
- サウジアラビア
- アラブ首長国連邦
第12章 企業プロファイル
- 世界企業
- Blue Yonder
- C3 Solutions
- Descartes Systems
- FourKites
- Infor
- Korber Supply Chain
- Manhattan Associates
- Oracle
- project44
- SAP
- Zebra Technologies
- 地域プレイヤー
- SIGHT Connect
- Alpega
- Dock411
- E2 open
- GoRamp
- Kale Logistics Solutions
- Opendock
- Softeon
- Transporeon
- Trimble Transportation
- Velostics
- YardView
- 新興企業
- Arrivy
- Conduit
- DataDocks
- Epicor Software
- Extensiv(formerly 3 PL Central)
- LoadingCalendar

