
|
市場調査レポート
商品コード
1892890
レアアース金属市場の機会、成長要因、業界動向分析、および2025年から2034年までの予測Rare Earth Metals Market Opportunity, Growth Drivers, Industry Trend Analysis, and Forecast 2025 - 2034 |
||||||
カスタマイズ可能
|
|||||||
| レアアース金属市場の機会、成長要因、業界動向分析、および2025年から2034年までの予測 |
|
出版日: 2025年12月03日
発行: Global Market Insights Inc.
ページ情報: 英文 190 Pages
納期: 2~3営業日
|

概要
世界のレアアース金属市場は、2024年に182億米ドルと評価され、2034年までにCAGR7.6%で成長し、367億米ドルに達すると予測されています。
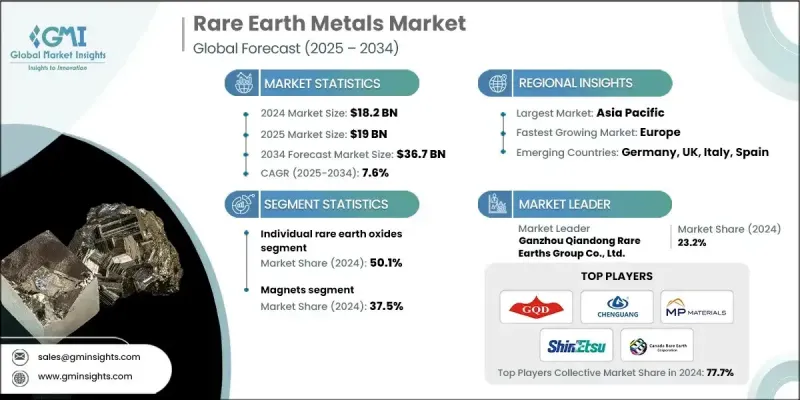
市場拡大の背景には、電気自動車、再生可能エネルギー技術、先端電子機器、現代防衛システムに不可欠な高性能材料への世界の依存度の高まりがあります。優れた磁気特性、熱特性、光学特性で知られるレアアース金属は、モーター、バッテリー、センサー、触媒、通信システムの動力源として不可欠な役割を果たしています。産業がクリーンエネルギーと電化へ積極的に移行する中、これらの重要鉱物への需要は加速し続けています。さらに、世界各国の政府は、限られた地理的供給源への依存度を低減するため、サプライチェーンの安全保障をますます優先し、新たな鉱業投資、リサイクルの取り組み、戦略的備蓄を推進しております。
| 市場範囲 | |
|---|---|
| 開始年 | 2024年 |
| 予測期間 | 2025-2034 |
| 開始時価値 | 182億米ドル |
| 予測金額 | 367億米ドル |
| CAGR | 7.6% |
個々の希土類酸化物セグメントは、2024年に50.1%を占め、2034年までCAGR(7.7%)で成長すると予測されています。これらの個別の希土類金属に対する需要は、先端技術分野での応用範囲が拡大し続けるにつれ、急速に高まっています。特にネオジム、プラセオジム、ジスプロシウムといった元素は、電気自動車、風力発電システム、電子機器などに使用される高性能永久磁石において重要な役割を担っているため、需要が特に強く伸びています。
用途別では、磁石セグメントが2024年に37.5%のシェアを占めました。これはクリーンエネルギー技術や産業オートメーション分野での急速な採用が牽引しています。優れた磁気強度、耐久性、エネルギー効率により、現代のモーター、タービン、医療機器、精密機器において代替不可能な存在となっています。
アジア太平洋の希土類金属市場は2034年までにCAGR 8.3%で拡大し、希土類金属の採掘・加工・製造における世界の拠点としての地位を強化します。中国の膨大な生産能力と、電子機器・自動車・再生可能エネルギー産業からの強い需要が相まって、同地域の主導的地位を支えています。さらに、電気自動車(EV)製造の急速な拡大、洋上風力発電プロジェクトの開発、半導体生産の着実な成長が、希土類元素の消費増加を後押ししています。
よくあるご質問
目次
第1章 調査手法と範囲
第2章 エグゼクティブサマリー
第3章 業界考察
- エコシステム分析
- サプライヤーの情勢
- 利益率
- 各段階における付加価値
- バリューチェーンに影響を与える要因
- ディスラプション
- 業界への影響要因
- 促進要因
- 業界の潜在的リスク&課題
- 市場機会
- 成長可能性分析
- 規制情勢
- 北米
- 欧州
- アジア太平洋地域
- ラテンアメリカ
- 中東・アフリカ
- ポーター分析
- PESTEL分析
- 価格動向
- 地域別
- 製品タイプ別
- 将来の市場動向
- 技術とイノベーションの動向
- 現在の技術動向
- 新興技術
- 特許状況
- 貿易統計(HSコード)(注:貿易統計は主要国のみ提供されます)
- 主要輸入国
- 主要輸出国
- 持続可能性と環境面
- 持続可能な取り組み
- 廃棄物削減戦略
- 生産におけるエネルギー効率
- 環境に配慮した取り組み
- カーボンフットプリントへの配慮
第4章 競合情勢
- イントロダクション
- 企業の市場シェア分析
- 地域別
- 北米
- 欧州
- アジア太平洋地域
- ラテンアメリカ
- 中東・アフリカ地域
- 地域別
- 企業マトリクス分析
- 主要市場企業の競合分析
- 競合ポジショニングマトリックス
- 主な発展
- 合併・買収
- 提携・協業
- 新製品の発売
- 事業拡大計画
第5章 市場推計・予測:製品タイプ別、2021-2034
- 混合希土類酸化物(MREO)
- 軽希土類元素酸化物混合物
- 重希土類元素酸化物混合物
- 軽希土類元素酸化物と重希土類元素酸化物のバランス混合物
- 個々の希土類酸化物
- 軽希土類元素酸化物
- 重希土類元素酸化物
- イットリウム族酸化物
- 個々の希土類金属
- セリウム
- ジスプロシウム
- エルビウム
- ガドリニウム
- ランタン
- ネオジム
- プラセオジム
- サマリウム
- スカンジウム
- テルビウム
- イッテルビウム
- イットリウム
- その他(ユーロピウム、ホルミウム、ルテチウム、プロメチウム、およびツリウム)
第6章 市場推計・予測:用途別、2021-2034
- 磁石
- 着色剤
- 合金
- 光学機器
- 触媒
- その他
第7章 市場推計・予測:地域別、2021-2034
- 北米
- 米国
- カナダ
- 欧州
- ドイツ
- 英国
- フランス
- スペイン
- イタリア
- その他欧州地域
- アジア太平洋地域
- 中国
- インド
- 日本
- オーストラリア
- 韓国
- その他アジア太平洋地域
- ラテンアメリカ
- ブラジル
- メキシコ
- アルゼンチン
- その他ラテンアメリカ地域
- 中東・アフリカ
- サウジアラビア
- 南アフリカ
- アラブ首長国連邦
- その他中東・アフリカ地域
第8章 企業プロファイル
- American Elements
- Arafura Rare Earths
- Australian Strategic Materials(ASM)
- Canada Rare Earth Corporation
- Energy Fuels Inc
- Ganzhou Chenguang Rare Earths New Material Co., Ltd.
- Ganzhou Qiandong Rare Earths Group Co., Ltd.
- Iluka Resources Limited
- Indian Rare Earths Limited
- Lynas Rare Earths Ltd
- MP Materials
- Neo Performance Materials
- Northern Minerals Limited
- Rio Tinto
- Shin-Etsu Chemical Co., Ltd.
- Western Minmetals(SC)Corporation

