
|
市場調査レポート
商品コード
1750606
金属ガラスの市場機会、成長促進要因、産業動向分析、2025年~2034年予測Metallic Glasses Market Opportunity, Growth Drivers, Industry Trend Analysis, and Forecast 2025 - 2034 |
||||||
カスタマイズ可能
|
|||||||
| 金属ガラスの市場機会、成長促進要因、産業動向分析、2025年~2034年予測 |
|
出版日: 2025年05月09日
発行: Global Market Insights Inc.
ページ情報: 英文 235 Pages
納期: 2~3営業日
|

全表示
- 概要
- 目次
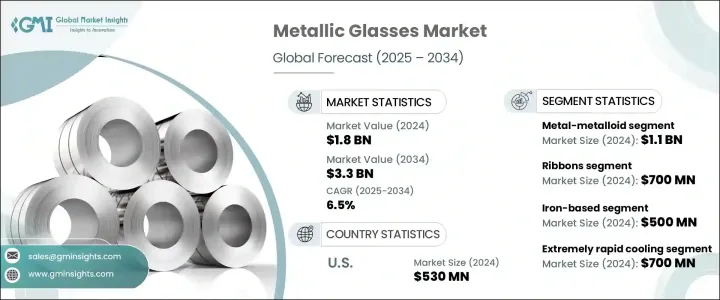
金属ガラスの世界市場は、2024年には18億米ドルと評価され、2034年までにはCAGR6.5%で成長し33億米ドルに達すると推定されています。
これは、金属ガラスのユニークな特性によって牽引されており、高張力と優れた耐食性、展性を兼ね備えています。これらの材料はアモルファス原子構造により、厳しい条件下でも非常に優れた性能を発揮し、構造強度と精度に理想的な材料となっています。電気部品や磁気部品など、耐久性と耐摩耗性を必要とする産業で有用です。産業界がより高度で効率的な材料を求め続ける中、金属ガラスの多目的な用途は支持を集めています。
市場は、電磁石およびエレクトロニクス分野での需要増加から恩恵を受けています。金属ガラスの低消費電力と高効率は、磁気コア、センサー、トランスに適しています。さらに、急速凝固や物理蒸着などの製造技術の進歩により、製造コストが削減され、スケーラブルな操業が可能になっています。生体適合性と機械的強度が医療用インプラントや手術器具に理想的であるため、バイオメディカル分野も金属ガラスの重要な成長分野です。バクテリアや磨耗に対する耐性が、ヘルスケア用途の魅力を高めています。
| 市場範囲 | |
|---|---|
| 開始年 | 2024年 |
| 予測年 | 2025年~2034年 |
| 開始金額 | 18億米ドル |
| 予測金額 | 33億米ドル |
| CAGR | 6.5% |
2024年、金属ガラス市場のメタル・メタロイド分野の市場規模は11億米ドルで、特にコンシューマーエレクトロニクス、AR/VR(拡張現実/仮想現実)、医療機器などの産業において、軽量でコスト効率に優れた材料への需要が高まっていることを背景に、2034年までCAGR5.7%で成長すると予測されています。これらの材料は、強度と柔軟性の完璧なバランスを提供するため、急速に発展するこれらの分野の小型化部品に最適です。技術の進歩により、より小型で効率的な製品が求められる中、金属メタロイドガラスの採用は様々な用途で加速すると予想されます。
2024年に7億米ドルと評価されたリボンセグメントは、2034年まで5.1%の成長率を記録すると予測されています。これは、その優れた磁気特性により、特に変圧器や磁気センサーでの使用に適しているためです。高度な電子システム、エネルギー効率の高い機器、より精密なセンサー技術の需要が高まるにつれ、金属ガラス製のリボンはこれらの用途で重要な役割を果たし続けると考えられています。高性能を維持しながら厳しい条件下でも性能を発揮できる金属ガラスのリボンは、発電、エネルギー配給、ハイテクセンシング技術に重点を置く産業にとって重要な資産となります。
米国の金属ガラス市場は、2024年には5億3,000万米ドルとなり、2025年から2034年までのCAGR成長率は6%と予測され、航空宇宙、防衛システム、エレクトロニクスにおける金属ガラスの需要拡大が牽引しています。メーカーと防衛請負業者間の緊密な連携が、新しい金属ガラスソリューションの開発と流通を促進しています。さらに、米国の研究機関は新合金の開発や生産プロセスの最適化において重要な役割を果たしており、これが市場の拡大をさらに後押ししています。
金属ガラス世界市場の主要企業には、Heraeus Holding GmbH、Liquidmetal Technologies Inc.、Materion Corporation、Usha Amorphous Metals Limited、itachi Metals Ltd. などがあります。金属ガラス市場の各企業は、存在感を高めるため、生産能力を拡大し、製造プロセスを改良してコストを削減することに注力しています。研究機関や他の業界プレーヤーとの戦略的パートナーシップやコラボレーションは、技術革新と新素材の導入を加速するのに役立っています。メーカーは、様々な産業で高まる高性能材料への需要に対応するため、積層造形や先端合金開発などの技術進歩に投資しています。
目次
第1章 調査手法と範囲
第2章 エグゼクティブサマリー
第3章 業界考察
- 市場の定義と進化
- 金属ガラスの定義と分類
- 金属ガラスの歴史的開発
- 材料の組成と特性
- 原子の構造と特性
- 機械的特性
- 磁気特性
- 耐食性
- 熱特性
- 製造プロセス
- 急速凝固技術
- メルトスピニング
- ガスアトマイゼーション
- 吸引鋳造
- 積層造形
- 比較分析:金属ガラス vs.従来材料
- 金属ガラス vs.結晶金属
- 金属ガラス vs.セラミック
- 金属ガラス vs.ポリマー
- 金属ガラスにおける技術の進歩
- トランプ政権の関税の影響-構造化された概要
- 貿易への影響
- 貿易量の混乱
- 報復措置
- 業界への影響
- 供給側の影響(原材料)
- 主要原材料の価格変動
- サプライチェーンの再構築
- 生産コストへの影響
- 需要側の影響(販売価格)
- 最終市場への価格伝達
- 市場シェアの動向
- 消費者の反応パターン
- 影響を受ける主要企業
- 戦略的な業界対応
- サプライチェーンの再構成
- 価格設定と製品戦略
- 政策関与
- 展望と今後の検討事項
- 貿易への影響
- 貿易統計(HSコード)
- 主要輸出国
- 主要輸入国
- 利益率分析
- 規制状況と基準
- 世界の規制枠組み
- 地域規制枠組み
- 北米
- FDA規制(医療用途)
- ASTM規格
- その他の関連規制
- 欧州
- EU医療機器規制(MDR)
- CEマーキング要件
- リーチ規制
- アジア太平洋
- 中国の規制
- 日本の規制
- その他の地域規制
- 世界のその他の地域
- 北米
- 製品認証と規格
- 品質基準
- 安全基準
- パフォーマンス基準
- コンプライアンスの課題と戦略
- 将来の規制動向とその影響
- 市場力学
- 市場促進要因
- 優れた材料特性
- エレクトロニクス・エネルギー分野の需要増加
- 製造技術の進歩
- バイオメディカル分野での応用拡大
- 市場抑制要因
- 高い生産コスト
- サイズと形状の制限
- 脆さと延性の限界
- 従来の材料との競合
- 市場機会
- 航空宇宙・防衛における新たなアプリケーション
- 積層造形の進歩
- 持続可能な素材への需要の高まり
- 新興経済諸国の拡大
- 市場の課題
- 生産規模の拡大
- 一貫した品質の実現
- 規制遵守
- 市場の認知度と受容
- 市場促進要因
- ポーターのファイブフォース分析
- PESTEL分析
- バリューチェーン分析
- 原材料サプライヤー
- 製造業者
- 販売代理店
- エンドユーザー
- 環境・社会・ガバナンス(ESG)分析
- 環境影響評価
- カーボンフットプリント分析
- ライフサイクルアセスメント(LCA)
- 廃棄物管理とリサイクル
- 生産におけるエネルギー消費
- 社会的影響
- 労働慣行と労働条件
- コミュニティへの影響と関与
- 健康と安全に関する考慮事項
- ガバナンスと倫理的配慮
- コーポレートガバナンスの実践
- 倫理的なサプライチェーン管理
- 透明性と報告
- 主要プレーヤーのESGパフォーマンスベンチマーク
- ESGリスク評価と軽減戦略
- 金属ガラス業界における今後のESG動向
- 環境影響評価
- 製造・生産分析
- 製造プロセスの概要
- 原材料の調達と準備
- 合金の溶解と均質化
- 急速凝固技術
- 後処理と仕上げ
- 品質管理とテスト
- 生産コスト分析
- 原材料費
- エネルギーコスト
- 人件費
- 製造間接費
- コスト最適化戦略
- 製造施設分析
- 主要製造拠点
- 生産能力評価
- 施設拡張計画
- サプライチェーンの課題と解決策
- 製造プロセスにおける持続可能性
- エネルギー効率対策
- 廃棄物削減戦略
- 環境に優しい材料とプロセス
- 製造プロセスの概要
- 消費者行動と市場動向の分析
- 消費者の嗜好と購買パターン
- 購入決定に影響を与える要因
- パフォーマンスと品質
- コストの考慮
- 持続可能性要因
- ブランドの評判
- 業界固有の採用動向
- エレクトロニクス業界の採用
- 自動車業界での採用
- 医療業界での採用
- 航空宇宙産業の採用
- 消費者行動の地域差
- デジタル変革が消費者エンゲージメントに与える影響
- 将来の消費者動向とその影響
- 技術的情勢とイノベーション分析
- 金属ガラスの現在の技術動向
- 新興技術とその潜在的な影響
- 高度な製造技術
- 新しい合金組成
- 表面改質技術
- 複合金属ガラス
- 研究開発活動とイノベーションハブ
- アプリケーション全体にわたる技術採用動向
- 技術準備状況評価
- 将来の技術ロードマップ、2025年~2034年
- 価格分析と経済的要因
- 価格動向分析
- 歴史的価格動向
- 現在の価格シナリオ
- 価格予測
- 価格に影響を与える要因
- 原材料費
- 生産の複雑さ
- 生産規模
- 市場競争
- アプリケーション固有の要件
- 地域による価格差
- 価格と価値の関係分析
- 市場に影響を与える経済指標
- GDP成長率と工業生産
- 研究開発費
- 金属商品価格
- エネルギーコスト
- 主要市場プレーヤーの価格戦略
- 価格動向分析
- 原材料とサプライチェーンの分析
- 主要原材料の概要
- 金属・半金属
- 希土類元素
- その他の重要な材料
- 原材料の調達と調達
- 世界の供給源
- 供給の集中とリスク
- 持続可能な調達の取り組み
- サプライチェーンの構造とダイナミクス
- 上流サプライチェーン
- 中流処理
- 下流流通
- サプライチェーンの課題
- 原材料の入手可能性と重要性
- 価格変動
- 地政学的要因
- 物流と輸送
- サプライチェーンリスク軽減戦略
- 原材料とサプライチェーンの将来動向
- 主要原材料の概要
第4章 競合情勢
- 主要企業の市場シェア分析
- 競合ポジショニングマトリックス
- 主要プレーヤーが採用している競争戦略
- 製品の革新と開発
- 合併と買収
- パートナーシップとコラボレーション
- 拡大戦略
- 投資分析と市場の魅力
- 現在の投資シナリオ
- 投資機会:セグメント別
- 投資機会:地域別
- ROI分析
- ベンチャーキャピタルとプライベートエクイティの情勢
- M&A活動分析
- 将来の投資見通し
- リスク評価と軽減戦略
- 市場リスク
- 技術的リスク
- 規制リスク
- 競争リスク
- サプライチェーンのリスク
- 環境と持続可能性のリスク
- リスク軽減戦略
第5章 市場推計・予測:タイプ別、2021年~2034年
- 主要動向
- 金属-金属金属ガラス
- 金属-半金属金属ガラス
第6章 市場推計・予測:形態別、2021年~2034年
- 主要動向
- リボン
- ワイヤー
- 粉末
- シート
- その他
第7章 市場推計・予測:材料構成別、2021年~2034年
- 主要動向
- 鉄ベース
- ジルコニウムベース
- チタンベース
- 銅ベース
- パラジウムベース
- マグネシウムベース
- アルミニウムベース
- その他の構成
第8章 市場推計・予測:製造工程別、2021年~2034年
- 主要動向
- 極めて急速な冷却
- 物理蒸着
- 固体反応
- イオン照射
- その他
第9章 市場推計・予測:最終用途産業別、2021年~2034年
- 主要動向
- 電子・電気
- 自動車・輸送
- 航空宇宙・防衛
- 医療・ヘルスケア
- スポーツ・レジャー
- エネルギー
- 産業機器
- その他
第10章 市場推計・予測:地域別、2021年~2034年
- 主要動向
- 北米
- 米国
- カナダ
- 欧州
- ドイツ
- 英国
- フランス
- スペイン
- イタリア
- アジア太平洋
- 中国
- インド
- 日本
- オーストラリア
- 韓国
- ラテンアメリカ
- ブラジル
- メキシコ
- アルゼンチン
- 中東・アフリカ
- サウジアラビア
- 南アフリカ
- アラブ首長国連邦
第11章 企業プロファイル
- Amorphology Inc.
- Antai Technology Co.、Ltd.
- EPSON ATMIX Corporation
- Exmet AB
- Glassimetal Technology
- Heraeus Holding
- Hitachi Metals Ltd.
- Liquidmetal Technologies Inc.
- Materion Corporation
- PrometalTech
- PX Group SA
- Qingdao Yunlu Advanced Materials Technology Co.、Ltd.
- RS Alloys
- Usha Amorphous Metals Limited
The Global Metallic Glasses Market was valued at USD 1.8 billion in 2024 and is estimated to grow at a CAGR of 6.5% to reach USD 3.3 billion by 2034, driven by the unique properties of metallic glasses, which combine high tensile strength with excellent corrosion resistance and malleability. These materials' amorphous atomic structure allows them to perform exceptionally well under challenging conditions, making them ideal for structural strength and precision. They are useful in industries requiring durability and resistance to wear, such as electrical and magnetic components. As industries continue to demand more advanced and efficient materials, the versatile applications of metallic glasses are gaining traction.
The market benefits from increased demand in the electromagnetic and electronics sectors. Metallic glasses' low power dissipation and high efficiency make them suitable for magnetic cores, sensors, and transformers. Moreover, advancements in manufacturing technologies, such as rapid solidification and physical vapor deposition, are reducing production costs and enabling scalable operations. The biomedical sector is another key growth area for metallic glasses, as their biocompatibility and mechanical strength make them ideal for medical implants and surgical tools. Their resistance to bacteria and wear adds to their appeal for healthcare applications.
| Market Scope | |
|---|---|
| Start Year | 2024 |
| Forecast Year | 2025-2034 |
| Start Value | $1.8 Billion |
| Forecast Value | $3.3 Billion |
| CAGR | 6.5% |
In 2024, the metal-metalloid segment of the metallic glasses market was valued at USD 1.1 billion and is projected to grow at a CAGR of 5.7% through 2034 fueled by the rising demand for lightweight and cost-effective materials, particularly in industries such as consumer electronics, augmented reality/virtual reality (AR/VR), and medical devices. These materials offer the perfect balance of strength and flexibility, making them ideal for the miniaturized components in these fast-evolving sectors. As technological advancements push for smaller, more efficient products, the adoption of metal-metalloid glasses is expected to accelerate across various applications.
The ribbons segment, valued at USD 700 million in 2024, is also projected to experience a growth rate of 5.1% through 2034, attributed to their exceptional magnetic properties, which make them particularly suitable for use in transformers and magnetic sensors. As the demand for advanced electronic systems, energy-efficient equipment, and more precise sensor technologies increases, ribbons made from metallic glasses will continue to play a crucial role in these applications. Their ability to perform under demanding conditions while maintaining high performance makes them an asset for industries focusing on power generation, energy distribution, and high-tech sensing technologies.
U.S. Metallic Glasses Market was valued at USD 530 million in 2024, with a projected growth rate of 6% CAGR from 2025 to 2034, driven by the growing demand for metallic glasses in aerospace, defense systems, and electronics. Close collaboration between manufacturers and defense contractors is expediting the development and distribution of new metallic glass solutions. Additionally, research institutions in the U.S. are playing a vital role in advancing new alloys and optimizing production processes, which further supports the market's expansion.
Key companies in the Global Metallic Glasses Market include Heraeus Holding GmbH, Liquidmetal Technologies Inc., Materion Corporation, Usha Amorphous Metals Limited, and Hitachi Metals Ltd. To strengthen their presence, companies in the metallic glasses market focus on expanding production capabilities and refining manufacturing processes to reduce costs. Strategic partnerships and collaborations with research institutions and other industry players are helping accelerate innovation and the introduction of new materials. Manufacturers invest in technological advancements, such as additive manufacturing and advanced alloy development, to meet the growing demand for high-performance materials across various industries.
Table of Contents
Chapter 1 Methodology & Scope
- 1.1 Market scope & definition
- 1.2 Base estimates & calculations
- 1.3 Forecast calculation
- 1.4 Data sources
- 1.4.1 Primary
- 1.4.2 Secondary
- 1.4.2.1 Paid sources
- 1.4.2.2 Public sources
- 1.5 Primary research and validation
- 1.5.1 Primary sources
- 1.5.2 Data mining sources
Chapter 2 Executive Summary
- 2.1 Industry synopsis, 2021-2034
Chapter 3 Industry Insights
- 3.1 Market definition and evolution
- 3.1.1 Definition and classification of metallic glasses
- 3.1.2 Historical development of metallic glasses
- 3.1.3 Material composition and properties
- 3.1.3.1 Atomic structure and characteristics
- 3.1.3.2 Mechanical properties
- 3.1.3.3 Magnetic properties
- 3.1.3.4 Corrosion resistance
- 3.1.3.5 Thermal properties
- 3.1.4 Manufacturing processes
- 3.1.4.1 Rapid solidification techniques
- 3.1.4.2 Melt spinning
- 3.1.4.3 Gas atomization
- 3.1.4.4 Suction casting
- 3.1.4.5 Additive manufacturing
- 3.1.5 Comparative analysis: metallic glasses vs. Conventional materials
- 3.1.5.1 Metallic glasses vs. Crystalline metals
- 3.1.5.2 Metallic glasses vs. Ceramics
- 3.1.5.3 Metallic glasses vs. Polymers
- 3.1.6 Technological advancements in metallic glasses
- 3.2 Impact of trump administration tariffs – structured overview
- 3.2.1 Impact on trade
- 3.2.1.1 Trade volume disruptions
- 3.2.1.2 Retaliatory measures
- 3.2.2 Impact on the industry
- 3.2.2.1 Supply-side impact (raw materials)
- 3.2.2.2 Price volatility in key materials
- 3.2.2.3 Supply chain restructuring
- 3.2.2.4 Production cost implications
- 3.2.2.2 Demand-side impact (selling price)
- 3.2.2.2.1 Price transmission to end markets
- 3.2.2.2.2 Market share dynamics
- 3.2.2.2.3 Consumer response patterns
- 3.2.3 Key companies impacted
- 3.2.4 Strategic industry responses
- 3.2.4.1 Supply chain reconfiguration
- 3.2.4.2 Pricing and product strategies
- 3.2.4.3 Policy engagement
- 3.2.5 Outlook and future considerations
- 3.2.1 Impact on trade
- 3.3 Trade statistics (hs code)
- 3.3.1 Major exporting countries
- 3.3.2 Major importing countries
- 3.4 Profit margin analysis
- 3.5 Regulatory landscape and standards
- 3.5.1 Global regulatory framework
- 3.5.2 Regional regulatory frameworks
- 3.5.2.1 North America
- 3.5.2.1.1 Fda regulations (for medical applications)
- 3.5.2.1.2 Astm standards
- 3.5.2.1.3 Other relevant regulations
- 3.5.2.2 Europe
- 3.5.2.2.1 Eu medical device regulation (mdr)
- 3.5.2.2.2 Ce marking requirements
- 3.5.2.2.3 Reach regulations
- 3.5.2.3 Asia-pacific
- 3.5.2.3.1 China's regulations
- 3.5.2.3.2 Japan's regulations
- 3.5.2.3.3 Other regional regulations
- 3.5.2.4 Rest of the world
- 3.5.2.1 North America
- 3.5.3 Product certification and standards
- 3.5.3.1 Quality standards
- 3.5.3.2 Safety standards
- 3.5.3.3 Performance standards
- 3.5.4 Compliance challenges and strategies
- 3.5.5 Future regulatory trends and their implications
- 3.6 Market dynamics
- 3.6.1 Market drivers
- 3.6.1.1 Superior material properties
- 3.6.1.2 Increasing demand in electronics and energy sectors
- 3.6.1.3 Advancements in manufacturing technologies
- 3.6.1.4 Growing applications in biomedical field
- 3.6.2 Market restraints
- 3.6.2.1 High production costs
- 3.6.2.2 Limited size and shape capabilities
- 3.6.2.3 Brittleness and limited ductility
- 3.6.2.4 Competition from conventional materials
- 3.6.3 Market opportunities
- 3.6.3.1 Emerging applications in aerospace and defense
- 3.6.3.2 Advancements in additive manufacturing
- 3.6.3.3 Growing demand for sustainable materials
- 3.6.3.4 Expansion in developing economies
- 3.6.4 Market challenges
- 3.6.4.1 Scaling up production
- 3.6.4.2 Achieving consistent quality
- 3.6.4.3 Regulatory compliance
- 3.6.4.4 Market awareness and acceptance
- 3.6.1 Market drivers
- 3.7 Porter's five forces analysis
- 3.8 Pestle analysis
- 3.9 Value chain analysis
- 3.9.1 Raw material suppliers
- 3.9.2 Manufacturers
- 3.9.3 Distributors
- 3.9.4 End users
- 3.10 Environmental, social, and governance (esg) analysis
- 3.10.1 Environmental impact assessment
- 3.10.1.1 Carbon footprint analysis
- 3.10.1.2 Life cycle assessment (lca)
- 3.10.1.3 Waste management and recycling
- 3.10.1.4 Energy consumption in production
- 3.10.2 Social implications
- 3.10.2.1 Labor practices and working conditions
- 3.10.2.2 Community impact and engagement
- 3.10.2.3 Health and safety considerations
- 3.10.3 Governance and ethical considerations
- 3.10.3.1 Corporate governance practices
- 3.10.3.2 Ethical supply chain management
- 3.10.3.3 Transparency and reporting
- 3.10.4 Esg performance benchmarking of key players
- 3.10.5 Esg risk assessment and mitigation strategies
- 3.10.6 Future esg trends in the metallic glasses industry
- 3.10.1 Environmental impact assessment
- 3.11 Manufacturing and production analysis
- 3.11.1 Manufacturing process overview
- 3.11.1.1 Raw material procurement and preparation
- 3.11.1.2 Alloy melting and homogenization
- 3.11.1.3 Rapid solidification techniques
- 3.11.1.4 Post-processing and finishing
- 3.11.1.5 Quality control and testing
- 3.11.2 Production cost analysis
- 3.11.2.1 Raw material costs
- 3.11.2.2 Energy costs
- 3.11.2.3 Labor costs
- 3.11.2.4 Manufacturing overheads
- 3.11.2.5 Cost optimization strategies
- 3.11.3 Manufacturing facilities analysis
- 3.11.3.1 Key manufacturing locations
- 3.11.3.2 Production capacity assessment
- 3.11.3.3 Facility expansion plans
- 3.11.4 Supply chain challenges and solutions
- 3.11.5 Sustainability in manufacturing processes
- 3.11.5.1 Energy efficiency measures
- 3.11.5.2 Waste reduction strategies
- 3.11.5.3 Eco-friendly materials and processes
- 3.11.1 Manufacturing process overview
- 3.12 Consumer behavior and market trends analysis
- 3.12.1 Consumer preferences and purchasing patterns
- 3.12.2 Factors influencing purchase decisions
- 3.12.2.1 Performance and quality
- 3.12.2.2 Cost considerations
- 3.12.2.3 Sustainability factors
- 3.12.2.4 Brand reputation
- 3.12.3 Industry-specific adoption trends
- 3.12.3.1 Electronics industry adoption
- 3.12.3.2 Automotive industry adoption
- 3.12.3.3 Medical industry adoption
- 3.12.3.4 Aerospace industry adoption
- 3.12.4 Regional variations in consumer behavior
- 3.12.5 Impact of digital transformation on consumer engagement
- 3.12.6 Future consumer trends and their implications
- 3.13 Technological landscape and innovation analysis
- 3.13.1 Current technological trends in metallic glasses
- 3.13.2 Emerging technologies and their potential impact
- 3.13.2.1 Advanced manufacturing techniques
- 3.13.2.2 Novel alloy compositions
- 3.13.2.3 Surface modification technologies
- 3.13.2.4 Composite metallic glasses
- 3.13.3 R&d activities and innovation hubs
- 3.13.4 Technology adoption trends across applications
- 3.13.5 Technology readiness assessment
- 3.13.6 Future technology roadmap 2025-2034
- 3.14 Pricing analysis and economic factors
- 3.14.1 Pricing trends analysis
- 3.14.1.1 Historical price trends
- 3.14.1.2 Current pricing scenario
- 3.14.1.3 Price forecast
- 3.14.2 Factors affecting pricing
- 3.14.2.1 Raw material costs
- 3.14.2.2 Production complexity
- 3.14.2.3 Scale of production
- 3.14.2.4 Market competition
- 3.14.2.5 Application-specific requirements
- 3.14.3 Regional price variations
- 3.14.4 Price-value relationship analysis
- 3.14.5 Economic indicators impacting the market
- 3.14.5.1 Gdp growth and industrial production
- 3.14.5.2 R&d spending
- 3.14.5.3 Metal commodity prices
- 3.14.5.4 Energy costs
- 3.14.6 Pricing strategies of key market players
- 3.14.1 Pricing trends analysis
- 3.15 Raw materials and supply chain analysis
- 3.15.1 Key raw materials overview
- 3.15.1.1 Metals and metalloids
- 3.15.1.2 Rare earth elements
- 3.15.1.3 Other critical materials
- 3.15.2 Raw material sourcing and procurement
- 3.15.2.1 Global supply sources
- 3.15.2.2 Supply concentration and risks
- 3.15.2.3 Sustainable sourcing initiatives
- 3.15.3 Supply chain structure and dynamics
- 3.15.3.1 Upstream supply chain
- 3.15.3.2 Midstream processing
- 3.15.3.3 Downstream distribution
- 3.15.4 Supply chain challenges
- 3.15.4.1 Raw material availability and criticality
- 3.15.4.2 Price volatility
- 3.15.4.3 Geopolitical factors
- 3.15.4.4 Logistics and transportation
- 3.15.5 Supply chain risk mitigation strategies
- 3.15.6 Future trends in raw materials and supply chain
- 3.15.1 Key raw materials overview
Chapter 4 Competitive Landscape, 2024
- 4.1 Market share analysis of key players
- 4.2 Competitive positioning matrix
- 4.3 Competitive strategies adopted by key players
- 4.3.1 Product innovation and development
- 4.3.2 Mergers and acquisitions
- 4.3.3 Partnerships and collaborations
- 4.3.4 Expansion strategies
- 4.4 Investment analysis and market attractiveness
- 4.4.1 Current investment scenario
- 4.4.2 Investment opportunities by segment
- 4.4.3 Investment opportunities by region
- 4.4.4 Roi analysis
- 4.4.5 Venture capital and private equity landscape
- 4.4.6 M&a activity analysis
- 4.4.7 Future investment outlook
- 4.5 Risk assessment and mitigation strategies
- 4.5.1 Market risks
- 4.5.2 Technological risk
- 4.5.3 Regulatory risks
- 4.5.4 Competitive risks
- 4.5.5 Supply chain risks
- 4.5.6 Environmental and sustainability risks
- 4.5.7 Risk mitigation strategies
Chapter 5 Market Estimates and Forecast, By Type, 2021 – 2034 (USD Billion) (Kilo Tons)
- 5.1 Key trends
- 5.2 Metal-metal metallic glasses
- 5.3 Metal-metalloid metallic glasses
Chapter 6 Market Estimates and Forecast, By Form, 2021 – 2034 (USD Billion) (Kilo Tons)
- 6.1 Key trends
- 6.2 Ribbons
- 6.3 Wires
- 6.4 Powders
- 6.5 Sheets
- 6.6 Others
Chapter 7 Market Estimates and Forecast, By Material Composition, 2021 – 2034 (USD Billion) (Kilo Tons)
- 7.1 Key trends
- 7.2 Iron-based
- 7.3 Zirconium-based
- 7.4 Titanium-based
- 7.5 Copper-based
- 7.6 Palladium-based
- 7.7 Magnesium-based
- 7.8 Aluminum-based
- 7.9 Other compositions
Chapter 8 Market Estimates and Forecast, By Manufacturing Process, 2021 – 2034 (USD Billion) (Kilo Tons)
- 8.1 Key trends
- 8.2 Extremely rapid cooling
- 8.3 Physical vapor deposition
- 8.4 Solid-state reaction
- 8.5 Ion irradiation
- 8.6 Others
Chapter 9 Market Estimates and Forecast, By End Use Industry, 2021 – 2034 (USD Billion) (Kilo Tons)
- 9.1 Key trends
- 9.2 Electronics and electrical
- 9.3 Automotive and transportation
- 9.4 Aerospace and defense
- 9.5 Medical and healthcare
- 9.6 Sports and leisure
- 9.7 Energy
- 9.8 Industrial equipment
- 9.9 Others
Chapter 10 Market Estimates and Forecast, By Region, 2021 – 2034 (USD Billion) (Kilo Tons)
- 10.1 Key trends
- 10.2 North America
- 10.2.1 U.S.
- 10.2.2 Canada
- 10.3 Europe
- 10.3.1 Germany
- 10.3.2 UK
- 10.3.3 France
- 10.3.4 Spain
- 10.3.5 Italy
- 10.4 Asia Pacific
- 10.4.1 China
- 10.4.2 India
- 10.4.3 Japan
- 10.4.4 Australia
- 10.4.5 South Korea
- 10.5 Latin America
- 10.5.1 Brazil
- 10.5.2 Mexico
- 10.5.3 Argentina
- 10.6 Middle East and Africa
- 10.6.1 Saudi Arabia
- 10.6.2 South Africa
- 10.6.3 UAE
Chapter 11 Company Profiles
- 11.1 Amorphology Inc.
- 11.2 Antai Technology Co., Ltd.
- 11.3 EPSON ATMIX Corporation
- 11.4 Exmet AB
- 11.5 Glassimetal Technology
- 11.6 Heraeus Holding
- 11.7 Hitachi Metals Ltd.
- 11.8 Liquidmetal Technologies Inc.
- 11.9 Materion Corporation
- 11.10 PrometalTech
- 11.11 PX Group SA
- 11.12 Qingdao Yunlu Advanced Materials Technology Co., Ltd.
- 11.13 RS Alloys
- 11.14 Usha Amorphous Metals Limited

