
|
市場調査レポート
商品コード
1871274
仮想拡張LAN市場の機会、成長要因、業界動向分析、および2025年から2034年までの予測Virtual Extensible LAN (VXLAN) Market Opportunity, Growth Drivers, Industry Trend Analysis, and Forecast 2025 - 2034 |
||||||
カスタマイズ可能
|
|||||||
| 仮想拡張LAN市場の機会、成長要因、業界動向分析、および2025年から2034年までの予測 |
|
出版日: 2025年10月27日
発行: Global Market Insights Inc.
ページ情報: 英文 220 Pages
納期: 2~3営業日
|

概要
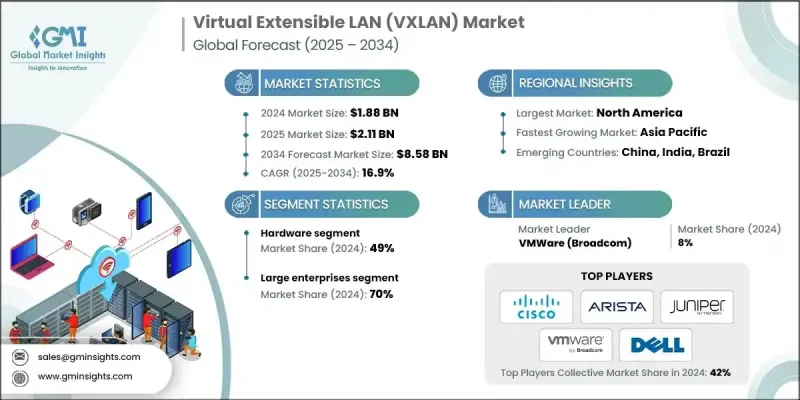
グローバル仮想拡張LAN(VXLAN)市場は、2024年に18億8,000万米ドルと評価され、2034年までにCAGR16.9%で成長し、85億8,000万米ドルに達すると予測されております。
VXLAN技術は、レイヤ2およびレイヤ3の境界を越えたスケーラブルで柔軟かつ効率的なネットワーク仮想化を実現することで、企業およびデータセンターのネットワークを変革しております。レイヤ3ネットワーク上でレイヤ2サービスを拡張することで俊敏性を高め、クラウド環境におけるワークロードの可搬性とマルチテナント性を向上させます。企業がワークロードをクラウドプラットフォームへ移行し続ける中、より高いスケーラビリティ、セキュリティ、柔軟性を提供する仮想化オーバーレイネットワークへの需要が加速しております。ネットワークインフラプロバイダーは、SDNコントローラー、自動化ツール、オーケストレーションフレームワークと統合された堅牢なVXLANエコシステムを開発し、導入効率の最適化を図っています。ハイパースケールデータセンターとクラウドコンピューティングの台頭は、膨大な東西方向トラフィックを管理し、仮想マシンの移動を容易にする動的でプログラム可能なネットワークを支えるVXLANプロトコルの利用を促進しています。VXLANオーバーレイは分散施設間のシームレスな相互接続を可能にし、弾力的なスケーラビリティとワークロード移行を実現します。これらは、回復力のあるエンタープライズおよびクラウドネイティブアーキテクチャの核心要件です。
| 市場範囲 | |
|---|---|
| 開始年 | 2024年 |
| 予測年度 | 2025-2034 |
| 開始時価値 | 18億8,000万米ドル |
| 予測金額 | 85億8,000万米ドル |
| CAGR | 16.9% |
ハードウェアセグメントは、VXLANカプセル化およびオーバーレイ技術に対応したスイッチ、ルーター、ゲートウェイなどの物理ネットワークコンポーネントに対する需要の高まりを背景に、2024年には49%のシェアを占めました。企業や大規模データセンターが、内部トラフィックやハイブリッドクラウド環境を管理できる高性能ハードウェアを優先する中、VXLAN対応スイッチ、ルーター、ネットワークインターフェースカードへの需要は引き続き拡大しています。このセグメントの成長は、高速スイッチング技術の革新と、SDNベースのネットワーク管理システムとの緊密な連携によって支えられています。
2024年には、クラウドコンピューティング、SDN、ネットワーク仮想化技術の広範な導入により、大企業セグメントが70%のシェアを占めました。これらの組織は、オンプレミスとマルチクラウドインフラを接続するためにVXLANオーバーレイを活用し、グローバルデータセンター全体で統一されたセキュリティポリシー、効率的なワークロード移行、集中化されたネットワーク管理を実現しています。VXLANフレームワーク内でのAIを活用した自動化の導入は、企業の運用効率向上と大規模分散システムの管理最適化をさらに促進しています。
米国における仮想拡張LAN(VXLAN)市場は2024年に6億3,230万米ドルを生み出し、90.5%のシェアを占めました。この優位性は、SDNの早期導入、クラウドファースト戦略、ハイパースケールデータセンターや企業による大規模導入に起因しています。米国は、先進的なITエコシステム、高いクラウド普及率、そしてVXLANとSDN、NFV、マルチクラウドオーケストレーションプラットフォームの統合により、安全でスケーラブルかつ自動化されたネットワーク仮想化を実現している点で優位性を有しています。
グローバル仮想拡張LAN(VXLAN)市場の主要企業には、シスコシステムズ、ジュニパーネットワークス、アリスタネットワークス、VMware(ブロードコム)、ヒューレット・パッカード・エンタープライズ(HPE)/アールバネットワークス、ファーウェイ・テクノロジーズ、カミュラスネットワークス(エヌビディアコーポレーション)、デルテクノロジーズ、エクストリームネットワークスなどが挙げられます。仮想拡張LAN(VXLAN)市場の主要企業が採用している主な戦略には、ソフトウェア定義ネットワーク(SDN)ポートフォリオの拡充、高速かつVXLAN対応ハードウェアへの投資、相互運用性強化のためのクラウドサービスプロバイダーとの提携などが挙げられます。また、企業はAIと自動化を活用し、動的なネットワークオーケストレーション、遅延の最適化、スケーラビリティの向上を図っています。継続的な研究開発活動、オープンネットワーキングの取り組み、ソフトウェア駆動型ネットワークソリューションプロバイダーの買収により、各社は製品ポートフォリオの強化、市場浸透率の向上、そして進化する企業の接続性ニーズへの対応を実現しております。
よくあるご質問
目次
第1章 調査手法
- 市場範囲と定義
- 調査設計
- 調査アプローチ
- データ収集方法
- データマイニングソース
- グローバル
- 地域別/国別
- 基本推定値と計算
- 基準年計算
- 市場推定における主要な動向
- 1次調査および検証
- 一次情報
- 予測モデル
- 調査前提条件と制限事項
第2章 エグゼクティブサマリー
第3章 業界考察
- エコシステム分析
- サプライヤーの情勢
- 利益率
- コスト構造
- 各段階における付加価値
- バリューチェーンに影響を与える要因
- ディスラプション
- 業界への影響要因
- 促進要因
- クラウドおよびデータセンターの急速な拡張
- ソフトウェア定義ネットワーク(SDN)の導入拡大
- ネットワークセグメンテーションとセキュリティに対する需要の高まり
- 仮想マシンの移動性の向上
- 業界の潜在的リスク&課題
- 複雑な導入と設定
- ベンダー間の相互運用性に関する課題
- 市場機会
- エッジおよび5Gネットワーク仮想化
- AI駆動型ネットワーク自動化
- クラウドネイティブおよびコンテナネットワーク
- 新興データセンター市場における拡大
- 促進要因
- 成長可能性分析
- 規制情勢
- グローバル
- IETF標準開発とRFCの進化
- IEEEネットワーク規格と相互運用性
- NISTサイバーセキュリティフレームワーク及びガイドライン
- オープンソースライセンシングと知的財産権
- 北米
- 欧州
- アジア太平洋地域
- ラテンアメリカ
- 中東・アフリカ
- グローバル
- ポーター分析
- PESTEL分析
- 技術とイノベーションの情勢
- 現在の技術動向
- 次世代VXLANの機能強化と標準規格の進化
- インテントベースドネットワーキング(IBN)との統合
- AI/機械学習によるネットワーク自動化・最適化
- エッジコンピューティングと5Gネットワークスライシングの統合
- 新興技術
- コンテナネットワーキングとKubernetesの統合
- セキュリティ強化とゼロトラストアーキテクチャ
- パフォーマンス最適化とハードウェアアクセラレーション
- マルチクラウドおよびハイブリッドクラウドにおけるネットワークの進化
- 技術導入障壁と緩和策
- 現在の技術動向
- 価格動向
- ハードウェア価格動向とコスト最適化
- ソフトウェアライセンシングモデルの進化(永久ライセンス対サブスクリプション)
- プロフェッショナルサービスの価格設定と市場相場
- クラウドベースおよびSaaSの価格モデル
- 総所有コスト(TCO)分析
- ベンダー間における価格性能のベンチマーク
- 生産統計
- 生産拠点
- 消費ハブ
- 輸出と輸入
- コスト内訳分析
- 特許分析
- 持続可能性と環境面
- 持続可能な実践
- 廃棄物削減戦略
- 生産におけるエネルギー効率化
- 環境に配慮した取り組み
- カーボンフットプリントに関する考慮事項
- 投資・資金調達分析
- ベンチャーキャピタル及びプライベートエクイティ投資動向
- 政府資金及びインフラ投資プログラム
- 研究開発投資の優先順位と技術開発
- 市場成熟度評価
- 顧客ニーズとベンダー能力のギャップ分析
- 企業要件評価と未充足ニーズ
- サービスプロバイダーの要求と現行提供内容の比較
- 中小企業向け市場のアクセシビリティと簡素化の課題
- パフォーマンスとスケーラビリティに関する期待値の齟齬
- ベンダーギャップ縮小戦略とロードマップ
- 製品開発及び機能強化計画
- パートナーシップ及びエコシステム拡大の取り組み
- トレーニング及び認定プログラムへの投資
- オープンソースへの貢献とコミュニティ構築
- 市場事例研究と導入分析
- 大企業におけるVXLAN導入事例
- クラウドサービスプロバイダーの導入事例
- 政府・防衛分野における導入成功事例
- 中小企業の導入パターンと得られた教訓
第4章 競合情勢
- イントロダクション
- 企業の市場シェア分析
- 北米
- 欧州
- アジア太平洋地域
- ラテンアメリカ
- 中東・アフリカ地域
- 主要市場企業の競合分析
- 競合ポジショニングマトリックス
- 戦略的展望マトリックス
- 主な発展
- 合併・買収
- 提携・協業
- 新製品の発売
- 拡大計画と資金調達
- 製品ポートフォリオ分析と差別化戦略
- ベンダー選定基準と顧客の意思決定要因
- チャネルパートナー及び流通ネットワーク分析
- 顧客満足度及びブランド認知度分析
第5章 市場推計・予測:コンポーネント別、2021-2034
- 主要動向
- ハードウェア
- スイッチ
- ルーター
- ゲートウェイ
- その他
- ソフトウェア
- VXLAN対応ネットワークオペレーティングシステム
- ネットワーク仮想化ソフトウェア
- ネットワーク管理およびオーケストレーションソフトウェア
- その他
- サービス
- 専門サービス
- コンサルティング
- 導入と統合
- サポートおよび保守
- マネージドサービス
- 専門サービス
第6章 市場推計・予測:企業規模別、2021-2034
- 主要動向
- 大企業
- 中小企業
第7章 市場推計・予測:用途別、2021-2034
- 主要動向
- マルチテナント
- ワークロードのモビリティ
- ソフトウェア定義ネットワーク(SDN)オーバーレイ
- ネットワーク機能仮想化(NFV)
- 災害復旧
- その他
第8章 市場推計・予測:最終用途別、2021-2034
- 主要動向
- 製造業
- ヘルスケア
- BFSI(銀行・金融・保険)
- 小売り
- メディア・エンターテインメント
- 政府
- IT・通信
- その他
第9章 市場推計・予測:導入形態別、2021-2034
- 主要動向
- オンプレミス
- クラウドベース
- ハイブリッド
第10章 市場推計・予測:地域別、2021-2034
- 主要動向
- 北米
- 米国
- カナダ
- 欧州
- ドイツ
- 英国
- フランス
- イタリア
- スペイン
- 北欧諸国
- ロシア
- ポーランド
- アジア太平洋地域
- 中国
- インド
- 日本
- 韓国
- ANZ
- ベトナム
- タイ
- ラテンアメリカ
- ブラジル
- メキシコ
- アルゼンチン
- 中東・アフリカ地域
- 南アフリカ
- サウジアラビア
- アラブ首長国連邦
第11章 企業プロファイル
- Global companies
- Arista Networks
- Cisco Systems
- Cumulus Networks(NVIDIA Corporation)
- Hewlett Packard Enterprise(HPE)
- Huawei Technologies
- Juniper Networks
- VMware(Broadcom)
- Hardware Infrastructure Leaders
- Dell Technologies
- Foxconn Technology Group
- Inspur Group
- Lenovo Group
- Quanta Computer
- Supermicro Computer
- Emerging &Disruptive Players
- Forward Networks
- Fungible Inc.(Microsoft)
- Kaloom Inc.
- Netris AI
- Pensando Systems(AMD)
- Veriflow Systems
- 地域・ニッチプレイヤー
- Allied Telesis
- D-Link Corporation
- Extreme Networks
- Netgear
- TP-Link Technologies
- Ubiquiti

