
|
市場調査レポート
商品コード
1913364
電気バス市場の機会、成長要因、業界動向分析、および2026年から2035年までの予測Electric Bus Market Opportunity, Growth Drivers, Industry Trend Analysis, and Forecast 2026 - 2035 |
||||||
カスタマイズ可能
|
|||||||
| 電気バス市場の機会、成長要因、業界動向分析、および2026年から2035年までの予測 |
|
出版日: 2025年12月24日
発行: Global Market Insights Inc.
ページ情報: 英文 206 Pages
納期: 2~3営業日
|

概要
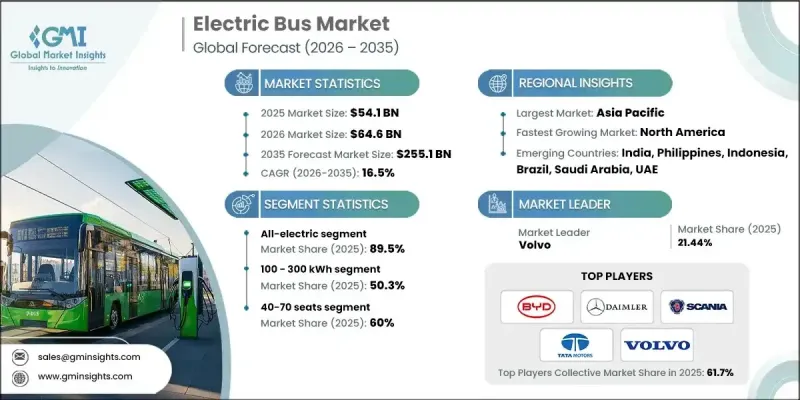
世界の電気バス市場は、2025年に541億米ドルと評価され、2035年までにCAGR 16.5%で成長し、2,551億米ドルに達すると予測されています。
公共交通システムが、よりクリーンな都市と効率的な運行を支えるため、電動化モビリティへ急速に移行する中、市場は急速に進化しています。電気バスは現在、先進的なバッテリーシステム、最適化された電動駆動系、インテリジェントなエネルギー管理、効率的な熱制御を備えて設計されており、これにより運用コストの削減とサービス信頼性の向上が可能となっています。交通当局は、老朽化した車両の近代化を図りながら、燃料費と維持費の削減、排出ガスの低減、乗客の快適性向上を目的として、これらの車両を導入しています。脱炭素化、大気質改善、持続可能な都市開発に向けた政策主導の取り組みが、電気バスの導入を直接加速させています。充電インフラ、車両のデジタル化、運用分析への大規模投資により、事業者は稼働時間を最大化し、ルート計画を改善することが可能となっています。電化が進むことで従来型燃料への依存度が低下する中、電気バスは都市間・都市内輸送ネットワーク全体において、環境性能と経済的安定性の双方を向上させる長期的解決策として、ますます注目されています。
| 市場範囲 | |
|---|---|
| 開始年 | 2025年 |
| 予測年度 | 2026-2035 |
| 開始時価値 | 541億米ドル |
| 予測金額 | 2,551億米ドル |
| CAGR | 16.5% |
2025年には全電気式カテゴリーが89.5%のシェアを占め、2035年までCAGR16.2%で成長すると予測されています。このセグメントは、ゼロエミッション運転、機械的複雑性の低減、強力な規制支援により市場をリードしています。交通事業者は、排出削減目標に沿いながら代替推進技術と比較してライフタイム所有コストが低いことから、完全電気式バスを好んで採用しています。
100~300kWhのバッテリー容量帯は、2025年に50.3%のシェアを占め、2026年から2035年にかけてCAGR16.6%で拡大すると予想されます。このバッテリークラスは、航続距離、充電効率、車両重量のバランスに優れているため、広く採用されています。この容量帯のバスは、過度な充電中断なしに日常的な路線運行要件を満たすため、事業者様が安定した運行スケジュールを維持し、運用コストを管理するのに役立ちます。
中国電気バス市場は2025年に65.5%のシェアを占め、210億8,000万米ドルの規模を達成しました。市場主導地位は、強力な政策整合性、長期的な車両電動化プログラム、従来型バスから電気バスへの広範な代替導入によって支えられています。公共交通近代化への継続的な投資により、大都市圏および地方ネットワーク全体で高い導入水準が維持されています。
よくあるご質問
目次
第1章 調査手法
第2章 エグゼクティブサマリー
第3章 業界考察
- エコシステム分析
- サプライヤーの情勢
- 利益率分析
- コスト構造
- 各段階における付加価値
- バリューチェーンに影響を与える要因
- ディスラプション
- 業界への影響要因
- 促進要因
- ゼロエミッション公共交通機関に対する政府の義務付けの増加
- 電気バス導入に向けた公的資金および補助金の急増
- 都市部の大気質への懸念の高まりと持続可能性目標の強化
- ディーゼルバスと比較した総所有コストの低減に対する需要の増加
- バッテリーエネルギー密度とパワートレイン効率の進歩
- 業界の潜在的リスク&課題
- 電気バスおよび充電インフラの高額な初期費用
- 発展途上地域における充電インフラと送電網容量の不足
- 市場機会
- 新興経済国における電気バスの導入拡大
- 都市間および長距離バス路線の電動化拡大
- バッテリー交換およびエネルギー・アズ・ア・サービス(EaaS)ビジネスモデルの増加
- スマートシティ構想への電気バスの統合促進
- 促進要因
- 成長可能性分析
- 規制情勢
- 北米
- 米国連邦政府の電動化インセンティブとインフラ資金調達
- 欧州
- ドイツ:電気モビリティ法(EmoG)
- 英国:ゼロエミッションバス資金調達プログラム
- フランス:モビリティ指向法(LOM法)
- イタリア:国家エネルギー・気候計画(PNIEC)
- アジア太平洋地域
- 中国:新エネルギー車(NEV)義務化政策
- インド:FAME II電気バス補助金制度
- 日本:国家EV・FCV導入ロードマップ
- オーストラリア:州レベルのゼロエミッションバス目標
- ラテンアメリカ
- ブラジル:国家電気モビリティ政策(PNME)
- メキシコ:都市部におけるゼロエミッション公共交通プログラム
- アルゼンチン:州別クリーンモビリティ規制
- 中東・アフリカ
- UAE:電気自動車充電及びクリーン輸送規制
- サウジアラビア:ビジョン2030 EV輸送フレームワーク
- 南アフリカ:グリーン交通戦略
- 北米
- ポーター分析
- PESTEL分析
- 技術とイノベーションの動向
- 現在の技術動向
- 新興技術
- 特許分析
- 価格分析
- 地域別
- 推進力別
- 生産統計
- 生産拠点
- 消費拠点
- 輸出と輸入
- コスト内訳分析
- 車両コスト
- 運用コスト
- 総所有コスト(TCO)
- 充電インフラコスト
- 設置・稼働費用
- 研究開発費
- 持続可能性と環境影響分析
- 持続可能な実践
- 廃棄物削減戦略
- 生産におけるエネルギー効率
- 環境に配慮した取り組み
- カーボンフットプリントに関する考慮事項
- 将来展望と機会
- 技術ロードマップと進化のタイムライン
- 新たな応用分野の機会
- 投資要件と資金調達源
- リスク評価と軽減策
- 市場参入企業への戦略的提言
第4章 競合情勢
- イントロダクション
- 企業の市場シェア分析
- 主要市場企業の競合分析
- 競合ポジショニングマトリックス
- 戦略的展望マトリックス
- 主な発展
- 合併・買収
- 提携・協業
- 新製品の発売
- 事業拡大計画と資金調達
第5章 市場推計・予測:推進力別、2022-2035
- 全電気式
- PHEV
- 燃料電池自動車(FCEV)
第6章 市場推計・予測:座席数別、2022-2035
- 40席未満
- 40-70
- 70席以上
第7章 市場推計・予測:サービス別、2022-2035
- 都市間
- 市内
第8章 市場推計・予測:所有形態別、2022-2035
- 政府
- 自社所有車両
- リース及びレンタル
- 配車サービス事業者
- その他
第9章 市場推計・予測:充電インフラ別、2022-2035
- 公共充電ネットワーク
- 非公開
- ハイブリッド
第10章 市場推計・予測:バッテリー容量別、2022-2035
- 100kWh未満
- 100~300キロワット時
- 300kWh超
第11章 市場推計・予測:地域別、2022-2035
- 北米
- 米国
- カナダ
- 欧州
- ドイツ
- 英国
- フランス
- イタリア
- スペイン
- ロシア
- 北欧諸国
- アジア太平洋地域
- 中国
- インド
- 日本
- オーストラリア
- 韓国
- フィリピン
- インドネシア
- ラテンアメリカ
- ブラジル
- メキシコ
- アルゼンチン
- 中東・アフリカ地域
- 南アフリカ
- サウジアラビア
- アラブ首長国連邦
第12章 企業プロファイル
- 世界企業
- BYD
- Daimler
- Geely Automobile Holdings
- IVECO
- MAN Bus
- NFI
- Scania
- Tata Motors
- Volvo
- Zhengzhou Yutong Bus
- 地域メーカー
- Beiqi Foton Motor
- Ebusco
- Irizar
- King Long United Automotive
- Solaris Bus &Coach
- VDL Bus &Coach
- Xiamen Golden Dragon Bus
- 新興メーカー
- Anhui Ankai Automobile.
- Proterra
- Zhongtong Bus

