
|
市場調査レポート
商品コード
1716594
バウンスハウスの市場機会、成長促進要因、産業動向分析、2025年~2034年の予測Bounce House Market Opportunity, Growth Drivers, Industry Trend Analysis, and Forecast 2025 - 2034 |
||||||
カスタマイズ可能
|
|||||||
| バウンスハウスの市場機会、成長促進要因、産業動向分析、2025年~2034年の予測 |
|
出版日: 2025年03月10日
発行: Global Market Insights Inc.
ページ情報: 英文 387 Pages
納期: 2~3営業日
|

全表示
- 概要
- 目次
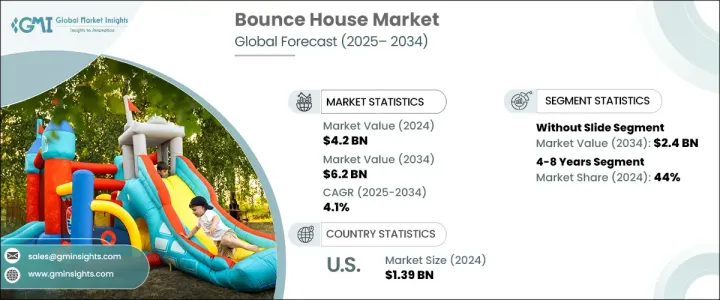
バウンスハウスの世界市場は2024年に42億米ドルに達し、2025年から2034年にかけてCAGR4.1%で成長すると予測されています。
同市場は、インフレータブルエンターテインメントソリューションの需要が世界的に高まる中、着実な成長を続けています。安全で、魅力的で、手頃な価格の子供向けエンターテイメントを求める家庭が増える中、バウンスハウスは様々な場面で楽しさいっぱいの体験を提供する最良の選択肢として浮上しています。バウンスハウスの人気は、遊園地、ファミリーエンターテインメントセンター、屋内遊び場が若い観客を惹きつけるためにサービスを拡大していることとも関連しています。
様々なテーマやデザインが用意されているこれらのアトラクションは、商業施設だけにとどまらず、誕生日パーティーや学校行事、企業のファミリーイベント、地域のお祭りなどでもよく見かけるようになりました。鮮やかな色彩、遊び心あふれるテーマ、カスタマイズ可能な機能を備えたバウンスハウスは、安全性と楽しさを優先する子どもたちにも親たちにも魅力的です。メーカーはまた、国際的な安全基準に準拠した高品質で耐久性のある材料を使用し、楽しさと安全性を兼ね備えた革新的なデザインの導入に注力しています。市場の成長は、可処分所得の増加や、特に屋外の遊び場が限られている都市部での子供のレクリエーション活動への関心の高まりによって、さらに後押しされています。
| 市場範囲 | |
|---|---|
| 開始年 | 2024年 |
| 予測年 | 2025年~2034年 |
| 開始金額 | 42億米ドル |
| 予測金額 | 62億米ドル |
| CAGR | 4.1% |
バウンスハウス市場は、製品タイプにより、滑り台付きバウンスハウス、滑り台なしバウンスハウス、障害物コース、コンボ、その他に区分されます。滑り台なしバウンスハウスは2024年に16億米ドルの売上を占め、2034年には24億米ドルになると予測されています。これらのモデルは、その多用途性と幅広い魅力で人気を集めています。クライミングウォール、インタラクティブな障害物、創造的なテーマなどの機能を備えた、滑り台なしバウンスハウスは、誕生日パーティー、学校のカーニバル、教会の集まりを含む様々なイベントのための好ましい選択肢です。視覚的に魅力的なデザインと設営のしやすさから、屋内外での使用に適しており、幅広い人気に貢献しています。
バウンスハウス市場は、年齢別に「4歳未満」「4~8歳」「8歳以上」に分けられます。2024年の市場シェアは、4~8歳が44%を占めています。このセグメントのバウンスハウスは、子供たちのエネルギー溢れる遊びのニーズを満たすように設計されており、活発な遊びを促進する安全かつエキサイティングな環境を提供しています。4歳未満の子供向けには、メーカーは運動スキルの発達と社会的交流を促す、柔らかく高さの低い構造物を作ることに注力しています。年長児向けには、障害物コースや登り坂など、より冒険的な要素を取り入れたバウンスハウスが、スリリングな遊びを求める子どもたちの要望に応えています。
米国のバウンスハウス市場は、年率3.8%のCAGRで成長するとみられています。インフレータブルエンターテインメントの主要市場である米国は、強力なサプライチェーンと、テーマ型やカスタマイズ型のバウンスハウスを提供する幅広いサプライヤーの恩恵を受けています。レジャーやレクリエーション活動への消費支出の増加と、厳格な安全規制や品質基準が、同国の市場成長を牽引し続けています。
目次
第1章 調査手法と調査範囲
第2章 エグゼクティブサマリー
第3章 業界洞察
- 業界エコシステム分析
- バリューチェーンに影響を与える要因
- 利益率分析
- ディスラプション
- 将来の展望
- メーカー
- 流通業者
- 小売業者
- 影響要因
- 成長促進要因
- 可処分所得の増加
- レンタル業者の成長
- 遊園地の成長
- 業界の潜在的リスク・課題
- 天候感度
- 市場の飽和
- 成長促進要因
- 消費者の購買行動分析
- 人口動向
- 購買決定に影響を与える要因
- 消費者の製品採用
- 好みの流通チャネル
- 希望価格帯
- 成長可能性分析
- 規制状況
- 価格分析
- ポーター分析
- PESTEL分析
第4章 競合情勢
- イントロダクション
- 企業市場シェア分析
- 競合のポジショニングマトリックス
- 戦略展望マトリックス
第5章 市場推計・予測:タイプ別、2021年~2034年
- 主要動向
- 滑り台あり
- 滑り台なし
- 障害物コース
- コンボ
- その他
第6章 市場推計・予測:年齢層別、2021年~2034年
- 主要動向
- 4歳未満
- 4~8歳
- 8歳以上
第7章 市場推計・予測:価格帯別、2021年~2034年
- 主要動向
- 低(500ドル以下)
- 中(500~1000ドル)
- 高(1000ドル以上)
第8章 市場推計・予測:最終用途別、2021年~2034年
- 主要動向
- 個人用
- 商業用
第9章 市場推計・予測:流通チャネル別、2021年~2034年
- 主要動向
- オンライン
- オフライン
第10章 市場推計・予測:地域別、2021年~2034年
- 主要動向
- 北米
- 米国
- カナダ
- 欧州
- 英国
- ドイツ
- フランス
- イタリア
- スペイン
- アジア太平洋
- 中国
- 日本
- インド
- 韓国
- オーストラリア
- ラテンアメリカ
- ブラジル
- メキシコ
- 中東・アフリカ
- 南アフリカ
- サウジアラビア
- アラブ首長国連邦
第11章 企業プロファイル
- B-Air
- Blast Zone
- Bouncer Depot
- Cloud 9
- Commercial Inflatable
- Cutting Edge Creations
- EZ Inflatables
- HEC Worldwide
- House of Bounce
- Inflatable Depot
- Jungle Jumps
- Magic Jump
- Ninja Jump
- Tent and Table
- Ultimate Jumpers
The Global Bounce House Market reached USD 4.2 billion in 2024 and is expected to grow at a CAGR of 4.1% during 2025-2034. The market continues to witness steady growth as the demand for inflatable entertainment solutions rises worldwide. As families increasingly seek safe, engaging, and affordable entertainment options for children, bounce houses have emerged as a top choice, offering fun-filled experiences for various occasions. The popularity of bounce houses is also tied to the growing number of amusement parks, family entertainment centers, and indoor playgrounds that are expanding their offerings to attract younger audiences.
These inflatable attractions, available in a wide range of themes and designs, are not just limited to commercial venues - they are now a common feature at birthday parties, school functions, corporate family events, and community festivals. With their vibrant colors, playful themes, and customizable features, bounce houses appeal to both children and parents who prioritize safety and enjoyment. Manufacturers are also focusing on introducing innovative designs that combine fun with safety, using high-quality, durable materials that comply with international safety standards. The market's growth is further supported by rising disposable incomes and a heightened focus on recreational activities for children, especially in urban areas where outdoor play spaces may be limited.
| Market Scope | |
|---|---|
| Start Year | 2024 |
| Forecast Year | 2025-2034 |
| Start Value | $4.2 Billion |
| Forecast Value | $6.2 Billion |
| CAGR | 4.1% |
The bounce house market is segmented based on product types, including bounce houses with slides, without slides, obstacle courses, combos, and others. Bounce houses without slides accounted for USD 1.6 billion in revenue in 2024 and are projected to generate USD 2.4 billion by 2034. These models are gaining traction for their versatility and broad appeal. Equipped with features like climbing walls, interactive obstacles, and creative themes, bounce houses without slides are a preferred choice for various events, including birthday parties, school carnivals, and church gatherings. Their visually attractive designs and ease of setup make them ideal for both indoor and outdoor use, contributing to their widespread popularity.
By age group, the bounce house market is divided into up to 4 years, 4-8 years, and over 8 years categories. The 4-8 years age group held a dominant 44% market share in 2024. Bounce houses in this segment are designed to meet the high-energy play needs of children, offering safe yet exciting environments that foster active play. For children under 4 years old, manufacturers focus on creating soft, low-height structures that encourage motor skill development and social interaction. For older children, bounce houses with more adventurous elements like obstacle courses and challenging climbs cater to their demand for thrilling play experiences.
The U.S. Bounce House Market is set to grow at a CAGR of 3.8% annually. As the leading market for inflatable entertainment, the U.S. benefits from a strong supply chain and a wide range of suppliers offering themed and customized bounce house designs. Rising consumer spending on leisure and recreational activities, combined with stringent safety regulations and quality standards, continues to drive market growth in the country.
Table of Contents
Chapter 1 Methodology & Scope
- 1.1 Market scope & definition
- 1.2 Base estimates & calculations
- 1.3 Forecast parameters
- 1.4 Data sources
- 1.4.1 Primary
- 1.5 Secondary
- 1.5.1.1 Paid sources
- 1.5.1.2 Public sources
Chapter 2 Executive Summary
- 2.1 Industry synopsis, 2021 - 2034
Chapter 3 Industry Insights
- 3.1 Industry ecosystem analysis
- 3.1.1 Factor affecting the value chain
- 3.1.2 Profit margin analysis
- 3.1.3 Disruptions
- 3.1.4 Future outlook
- 3.1.5 Manufacturers
- 3.1.6 Distributors
- 3.1.7 Retailers
- 3.2 Impact forces
- 3.2.1 Growth drivers
- 3.2.1.1 Increasing disposable income
- 3.2.1.2 Growing rental agencies
- 3.2.1.3 Growing amusement parks
- 3.2.2 Industry pitfalls & challenges
- 3.2.2.1 Weather sensitivity
- 3.2.2.2 Market saturation
- 3.2.1 Growth drivers
- 3.3 Consumer buying behavior analysis
- 3.3.1 Demographic trends
- 3.3.2 Factors affecting buying decision
- 3.3.3 Consumer product adoption
- 3.3.4 Preferred distribution channel
- 3.3.5 Preferred price range
- 3.4 Growth potential analysis
- 3.5 Regulatory landscape
- 3.6 Pricing analysis
- 3.7 Porter's analysis
- 3.8 PESTEL analysis
Chapter 4 Competitive Landscape, 2024
- 4.1 Introduction
- 4.2 Company market share analysis
- 4.3 Competitive positioning matrix
- 4.4 Strategic outlook matrix
Chapter 5 Market Estimates and Forecast, By Type, 2021 – 2034 (USD Billion) (Million Units)
- 5.1 Key trends
- 5.2 With slide
- 5.3 Without slide
- 5.4 Obstacle course
- 5.5 Combo
- 5.6 Others
Chapter 6 Market Estimates & Forecast, By Age Group, 2021-2034 (USD Billion) (Million Units)
- 6.1 Key trends
- 6.2 Upto 4 years
- 6.3 4-8 years
- 6.4 Above 8 years
Chapter 7 Market Estimates & Forecast, By Price Range, 2021-2034 (USD Billion) (Million Units)
- 7.1 Key trends
- 7.2 Low (upto 500$)
- 7.3 Mid (500$-1000$)
- 7.4 High (more than 1000$)
Chapter 8 Market Estimates & Forecast, By End Use, 2021-2034 (USD Billion) (Million Units)
- 8.1 Key trends
- 8.2 Individual
- 8.3 Commercial
Chapter 9 Market Estimates & Forecast, By Distribution Channel, 2021-2034 (USD Billion) (Million Units)
- 9.1 Key trends
- 9.2 Online
- 9.3 Offline
Chapter 10 Market Estimates & Forecast, By Region, 2021 – 2034, (USD Billion) (Million Units)
- 10.1 Key trends
- 10.2 North America
- 10.2.1 U.S.
- 10.2.2 Canada
- 10.3 Europe
- 10.3.1 UK
- 10.3.2 Germany
- 10.3.3 France
- 10.3.4 Italy
- 10.3.5 Spain
- 10.4 Asia Pacific
- 10.4.1 China
- 10.4.2 Japan
- 10.4.3 India
- 10.4.4 South Korea
- 10.4.5 Australia
- 10.5 Latin America
- 10.5.1 Brazil
- 10.5.2 Mexico
- 10.6 MEA
- 10.6.1 South Africa
- 10.6.2 Saudi Arabia
- 10.6.3 UAE
Chapter 11 Company Profiles (Business Overview, Financial Data, Product Landscape, Strategic Outlook, SWOT Analysis)
- 11.1 B-Air
- 11.2 Blast Zone
- 11.3 Bouncer Depot
- 11.4 Cloud 9
- 11.5 Commercial Inflatable
- 11.6 Cutting Edge Creations
- 11.7 EZ Inflatables
- 11.8 HEC Worldwide
- 11.9 House of Bounce
- 11.10 Inflatable Depot
- 11.11 Jungle Jumps
- 11.12 Magic Jump
- 11.13 Ninja Jump
- 11.14 Tent and Table
- 11.15 Ultimate Jumpers

