
|
市場調査レポート
商品コード
1871290
ウインチ市場の機会、成長要因、業界動向分析、および2025年から2034年までの予測Winch Market Opportunity, Growth Drivers, Industry Trend Analysis, and Forecast 2025 - 2034 |
||||||
カスタマイズ可能
|
|||||||
| ウインチ市場の機会、成長要因、業界動向分析、および2025年から2034年までの予測 |
|
出版日: 2025年10月23日
発行: Global Market Insights Inc.
ページ情報: 英文 250 Pages
納期: 2~3営業日
|

概要
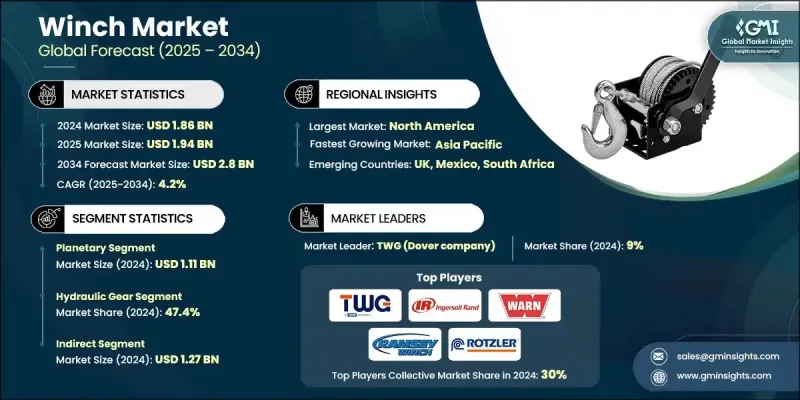
世界のウインチ市場は2024年に18億6,000万米ドルと評価され、2034年までにCAGR4.2%で成長し、28億米ドルに達すると予測されています。
都市の拡大と産業の成長が、この市場の需要を牽引する主な要因です。都市が発展しインフラプロジェクトが増加するにつれ、効率的なマテリアルハンドリングソリューションの必要性が高まっており、ウインチは重量物の吊り上げ、構造部材の移動、地下建設やパイプライン設置の支援において重要な役割を果たしています。特に新興経済国における大規模な都市開発計画やスマートシティプロジェクトは、多様な条件下で確実に機能する汎用性の高い大容量ウインチシステムへの需要を生み出しています。同様に重要なのが工業化の進展です。製造工場、倉庫、物流業務において、手作業に代わる機械化ソリューションの導入が進み、安全性の向上と業務効率の最適化が図られています。自動組立ライン、貨物取扱システム、設備保守作業へのウインチの統合は、自動車、化学、鉄鋼、重機械などの業界で安定した需要を生み出し、持続的な市場見通しを確かなものにしています。
| 市場範囲 | |
|---|---|
| 開始年 | 2024年 |
| 予測年度 | 2025-2034 |
| 開始時価値 | 18億6,000万米ドル |
| 予測金額 | 28億米ドル |
| CAGR | 4.2% |
遊星歯車式ウインチセグメントは、2024年に11億1,000万米ドルの市場規模を生み出しました。遊星歯車式ウインチは、コンパクト設計でありながら高トルクを発生できる点が高く評価されており、重作業用途に適しています。複数の歯車接触点に負荷を分散させることで、これらのシステムは滑らかな作動、効率的な負荷管理、機械的複雑性の低減を実現します。負荷変動下でも安定した動力伝達が可能であるため、産業用巻き上げ、海洋作業、機器回収など、精度と信頼性が求められる用途に最適です。
油圧式ギアウインチセグメントは、2024年に47.4%のシェアを占めました。油圧式ウインチは、長時間にわたり安定したトルクと出力を維持できる特性から、産業用・商業用用途において信頼性の高い選択肢とされています。長時間使用時に過熱や効率低下を起こす可能性のある電動式とは異なり、油圧システムは高温・多湿・粉塵・腐食といった過酷な環境下でも安定した性能を発揮します。頑丈な設計、強化シール、堅牢な構造により、海洋・鉱業・オフショア作業など厳しい環境下での運用が可能です。
米国ウィンチ市場は2024年に75.6%のシェアを占め、5億3,000万米ドルの売上高を生み出しました。同国の強固な産業基盤とインフラ近代化への継続的な投資が相まって、建設、海洋、防衛、石油・ガス分野におけるウィンチの安定した需要を牽引しています。重量物の吊り上げや牽引に不可欠なウィンチは、都市化の進展、エネルギーインフラ開発、輸送システムの近代化により、市場成長がさらに加速しています。
グローバルウィンチ市場における主要企業には、ワーン・インダストリーズ、ルーマール、スーパーウィンチ、ロッツラー、エース・ウィンチズ、ダットン・レインソン・カンパニー、トランスビクトリー・ウィンチ・システム、パルフィンガー・マリン、ラムジー・ウィンチ、TWG(ドーバー・カンパニー)、インガーソル・ランド、コロンバス・マッキノン、カムアップ・インダストリーズなどが挙げられます。ウィンチ市場の企業は、存在感を強化し市場シェアを拡大するため、複数の戦略を採用しております。多様な産業用途に向けた製品の効率性、耐久性、適応性を高めるため、研究開発への投資を進めております。特殊用途向けや高容量ウィンチを含む製品ポートフォリオの拡充は、複数の最終用途セクターの要求に対応するのに役立ちます。販売代理店、請負業者、レンタルサービスプロバイダーとの戦略的提携により、より広範な市場アクセスと迅速な導入が可能となります。
よくあるご質問
目次
第1章 調査手法と範囲
第2章 エグゼクティブサマリー
第3章 業界考察
- エコシステム分析
- サプライヤーの情勢
- 利益率
- 各段階における付加価値
- バリューチェーンに影響を与える要因
- 業界への影響要因
- 促進要因
- 都市化と工業化
- 石油・ガス探査活動の増加
- 産業の機械化と物流
- 業界の潜在的リスク&課題
- 初期費用が高額であること
- 規制および安全コンプライアンス
- 機会
- 技術革新とスマートウインチ
- カスタマイズとモジュラー設計
- 促進要因
- 成長可能性分析
- 将来の市場動向
- 技術とイノベーションの情勢
- 現在の技術動向
- 新興技術
- 価格動向
- 地域別
- 製品タイプ別
- 規制情勢
- 規格およびコンプライアンス要件
- 地域別規制枠組み
- 認証基準
- ポーター分析
- PESTEL分析
第4章 競合情勢
- イントロダクション
- 企業の市場シェア分析
- 地域別
- 企業マトリクス分析
- 主要市場企業の競合分析
- 競合ポジショニングマトリックス
- 主な発展
- 合併・買収
- 提携・協力関係
- 新製品の発売
- 拡大計画
第5章 市場推計・予測:製品タイプ別、2021-2034
- 主要動向
- 遊星歯車式
- ウォーム
第6章 市場推計・予測:操作別、2021-2034
- 主要動向
- 油圧式
- 電動式
- 空気圧式
- 手動
第7章 市場推計・予測:引張能力による区分, 2021-2034
- 主要動向
- 2000ポンド未満
- 2000~4000ポンド
- 4000~8000ポンド
- 8000~12000ポンド
- 12000~16000ポンド
- 16000~20000ポンド
- 20000~40000ポンド
- 40000~80000ポンド
- 80000ポンド以上
第8章 市場推計・予測:用途別、2021-2034
- 主要動向
- 商業用リカバリー
- 移動式クレーン
- 軍事用途
- 作業船
- ユーティリティ
- その他
第9章 市場推計・予測:最終用途産業別、2021-2034
- 主要動向
- 石油・ガス
- 船舶産業
- 鉱業
- 航空宇宙・防衛
- 自動車
- 建設
- 金属産業
- エネルギー・電力
- 運輸・マテリアルハンドリング
- その他
第10章 市場推計・予測:流通チャネル別、2021-2034
- 主要動向
- 直接
- 間接
第11章 市場推計・予測:地域別、2021-2034
- 主要動向
- 北米
- 米国
- カナダ
- 欧州
- ドイツ
- 英国
- フランス
- イタリア
- スペイン
- アジア太平洋地域
- 中国
- 日本
- インド
- オーストラリア
- 韓国
- ラテンアメリカ
- ブラジル
- メキシコ
- アルゼンチン
- 中東・アフリカ
- 南アフリカ
- サウジアラビア
- アラブ首長国連邦
第12章 企業プロファイル
- ACE Winches
- Columbus McKinnon
- COMEUP Industries
- Dutton-Lainson Company
- Ingersoll Rand
- Lewmar
- PALFINGER MARINE
- Ramsey Winch
- Rotzler
- Superwinch
- Thern
- Transvictory Winch System
- TWG(Dover company)
- Warn Industries
- WPT Power Corporation

