|
|
市場調査レポート
商品コード
1434025
農薬不活性成分市場:タイプ別、供給源別、農薬タイプ別&予測、2024年~2032年Pesticide Inert Ingredients Market - By Type (Emulsifiers, Solvents, Carriers), By Source (Synthetic, Bio-based), By Pesticides Type (Herbicides, Insecticides, Fungicides, Rodenticides) & Forecast, 2024- 2032 |
||||||
|
|||||||
カスタマイズ可能
|
|||||||

| 農薬不活性成分市場:タイプ別、供給源別、農薬タイプ別&予測、2024年~2032年 |
|
出版日: 2024年01月12日
発行: Global Market Insights Inc.
ページ情報: 英文 200 Pages
納期: 2~3営業日
|

全表示
- 概要
- 図表
- 目次
農薬不活性成分市場規模は、農業と食品生産需要の増加に牽引され、2024年から2032年にかけてCAGR 3.9%で拡大すると予想されています。
世界人口の急速な増加により、農作物の収量を守るための効率的な害虫駆除ソリューションの必要性が高まっています。不活性成分は、環境への影響を最小限に抑えながら効果的な害虫管理を確実にするため、殺虫剤製剤の有効性と安定性を高めるために不可欠となっています。世界貿易機関の最新の数字によると、会計2022-2023年度のインドの農薬輸出額は55億米ドルで、米国(54億米ドル)を抜いて世界第2位の農薬輸出国になりました。農業活動の活発化に伴う食糧生産の好況は、製品の取り込みに拍車をかけると思われます。
さらに、安全性評価と有効性評価に基づく政府のお墨付きが増えることで、市場の信頼が高まり、技術革新が促進されます。例えば2023年9月、中国の農業農村部はシクロブトリフルラムやフルスルフィナムを含む12の新規農薬を承認する計画を発表しました。このような支援により、進化する害虫管理の課題に対処するための性能を強化した新規製剤のイントロダクションが促進され、市場の拡大を促しています。
タイプ別に見ると、バイオベースの農薬不活性成分市場は2024年から2032年にかけてCAGR 4.1%を達成すると見られています。バイオベースの不活性成分は、植物抽出物や微生物代謝物のような再生可能な資源に由来し、環境への影響を低減した効果的な代替物質を提供します。
持続可能な農業に対する規制上の支援と、より環境に優しい製品を求める消費者の需要は、バイオベースの不活性成分の採用をさらに促進し、業界参加者に潜在的な成長機会を提供します。例えば、2023年11月、FMCは米国市場において、早期の病害虫や土壌伝染性害虫を幅広く駆除する殺虫剤/バイオ殺菌剤のプレミックス作物保護製品「Ethos Elite LFR」を発表しました。
農薬の種類別では、殺虫剤セグメントの農薬不活性成分市場は2024年から2032年にかけて4.1%のCAGRを記録すると予測されています。不活性成分は、殺虫剤製剤の有効性と安定性を高め、有効成分の分散を助け、接着性を向上させ、殺虫活性を高める。農業生産性と公衆衛生を守るための害虫駆除ソリューションの需要が高まるにつれ、殺虫剤における革新的な不活性成分の必要性が高まっています。さらに、製剤技術や規制要件の急速な進歩が、このセグメントの成長に寄与しています。
地域別では、欧州の農薬不活性成分産業は2024年から2032年にかけて4.2%の成長率で拡大する見通しです。環境と人体への安全性を重視した厳しい規制の実施が、同地域の規制基準を満たすための不活性成分の需要を促進しています。欧州では持続可能な農業と総合的害虫管理への注目が高まっており、製品アピールの促進要因となっています。さらに、環境に優しい製品や有機農法に対する消費者の嗜好の高まりも、天然資源由来の不活性成分の採用を後押しし、地域市場の拡大に拍車をかけています。
目次
第1章 調査手法と調査範囲
第2章 エグゼクティブサマリー
第3章 農薬不活性成分の業界洞察
- 生産エコシステム分析
- 業界への影響力
- 成長促進要因
- 業界の潜在的リスク&課題
- 成長可能性分析
- 規制状況
- 米国
- 欧州
- 価格分析、2022年
- 技術動向
- 将来市場動向
- ポーターの分析
- PESTEL分析
第4章 競合情勢
- イントロダクション
- 世界企業シェア分析
- 企業シェア分析、地域別、2022年
- 競合分析
- 競合ポジショニングマトリックス
- 戦略ダッシュボード
第5章 農薬不活性成分市場規模・予測:タイプ別、2018年~2032年
- 農薬不活性成分市場動向:タイプ別
- 乳化剤
- 溶剤
- 担体
- その他
第6章 農薬不活性成分市場規模・予測:供給源別、2018年~2032年
- 農薬不活性成分市場動向:供給源別
- 合成
- バイオベース
第7章 農薬不活性成分市場規模・予測:農薬タイプ別、2018年~2032年
- 農薬不活性成分市場動向:農薬タイプ別
- 除草剤
- 殺虫剤
- 殺菌剤
- 殺鼠剤
- その他
第8章 農薬不活性成分市場規模・予測:地域別、2018年~2032年
- 主要動向:地域別
- 北米
- 米国
- カナダ
- 欧州
- ドイツ
- 英国
- フランス
- スペイン
- イタリア
- アジア太平洋
- 日本
- 中国
- インド
- オーストラリア
- 韓国
- インドネシア
- マレーシア
- ラテンアメリカ
- ブラジル
- メキシコ
- アルゼンチン
- 中東・アフリカ
- 南アフリカ
- サウジアラビア
- アラブ首長国連邦
- エジプト
第9章 企業プロファイル
- BASF SE
- DowDuPont
- Clariant AG
- Croda International Plc
- Solvay SA
- Stepan Company
- Evonik Industries AG
- Royal Dutch Shell plc
- LyondellBasell Industries N.V.
- Huntsman Corporation
- Eastman Chemical Company
- AkzoNobel
- Lonza Group Ltd.
- Wacker Chemie AG
- Albemarle Corporation
Data Tables
- TABLE 1 Market revenue, by type (2022)
- TABLE 2 Marker revenue, by source (2022)
- TABLE 3 Market revenue, by pesticides type (2022)
- TABLE 4 Market revenue, by region (2022)
- TABLE 5 Global pesticide inert ingredients market size, 2018 - 2032, (USD Million)
- TABLE 6 Global pesticide inert ingredients market size, 2018 - 2032, (Tons)
- TABLE 7 Global pesticide inert ingredients market size, by region, 2018-2032 (USD Million)
- TABLE 8 Global pesticide inert ingredients market size, by region, 2018-2032 (Tons)
- TABLE 9 Global pesticide inert ingredients market size, by type, 2018-2032 (USD Million)
- TABLE 10 Global pesticide inert ingredients market size, by type, 2018-2032 (Tons)
- TABLE 11 Global pesticide inert ingredients market size, by source, 2018-2032 (USD Million)
- TABLE 12 Global pesticide inert ingredients market size, by source, 2018-2032 (Tons)
- TABLE 13 Global pesticide inert ingredients market size, by pesticides type, 2018-2032 (USD Million)
- TABLE 14 Global pesticide inert ingredients market size, by pesticides type, 2018-2032 (Tons)
- TABLE 15 Industry impact forces
- TABLE 16 North America pesticide inert ingredients market size, by country, 2018-2032 (USD Million)
- TABLE 17 North America pesticide inert ingredients market size, by country, 2018-2032 (Tons)
- TABLE 18 North America pesticide inert ingredients market size, by type, 2018-2032 (USD Million)
- TABLE 19 North America pesticide inert ingredients market size, by type, 2018-2032 (Tons)
- TABLE 20 North America pesticide inert ingredients market size, by source, 2018-2032 (USD Million)
- TABLE 21 North America pesticide inert ingredients market size, by source, 2018-2032 (Tons)
- TABLE 22 North America pesticide inert ingredients market size, by pesticides type, 2018-2032 (USD Million)
- TABLE 23 North America pesticide inert ingredients market size, by pesticides type, 2018-2032 (Tons)
- TABLE 24 U.S. pesticide inert ingredients market size, by type, 2018-2032 (USD Million)
- TABLE 25 U.S. pesticide inert ingredients market size, by type, 2018-2032 (Tons)
- TABLE 26 U.S. pesticide inert ingredients market size, by source, 2018-2032 (USD Million)
- TABLE 27 U.S. pesticide inert ingredients market size, by source, 2018-2032 (Tons)
- TABLE 28 U.S. pesticide inert ingredients market size, by pesticides type, 2018-2032 (USD Million)
- TABLE 29 U.S. pesticide inert ingredients market size, by pesticides type, 2018-2032 (Tons)
- TABLE 30 Canada pesticide inert ingredients market size, by type, 2018-2032 (USD Million)
- TABLE 31 Canada pesticide inert ingredients market size, by type, 2018-2032 (Tons)
- TABLE 32 Canada pesticide inert ingredients market size, by source, 2018-2032 (USD Million)
- TABLE 33 Canada pesticide inert ingredients market size, by source, 2018-2032 (Tons)
- TABLE 34 Canada pesticide inert ingredients market size, by pesticides type, 2018-2032 (USD Million)
- TABLE 35 Canada pesticide inert ingredients market size, by pesticides type, 2018-2032 (Tons)
- TABLE 36 Europe pesticide inert ingredients market size, by country, 2018-2032 (USD Million)
- TABLE 37 Europe pesticide inert ingredients market size, by country, 2018-2032 (Tons)
- TABLE 38 Europe pesticide inert ingredients market size, by type, 2018-2032 (USD Million)
- TABLE 39 Europe pesticide inert ingredients market size, by type, 2018-2032 (Tons)
- TABLE 40 Europe pesticide inert ingredients market size, by source, 2018-2032 (USD Million)
- TABLE 41 Europe pesticide inert ingredients market size, by source, 2018-2032 (Tons)
- TABLE 42 Europe pesticide inert ingredients market size, by pesticides type, 2018-2032 (USD Million)
- TABLE 43 Europe pesticide inert ingredients market size, by pesticides type, 2018-2032 (Tons)
- TABLE 44 Germany pesticide inert ingredients market size, by type, 2018-2032 (USD Million)
- TABLE 45 Germany pesticide inert ingredients market size, by type, 2018-2032 (Tons)
- TABLE 46 Germany pesticide inert ingredients market size, by source, 2018-2032 (USD Million)
- TABLE 47 Germany pesticide inert ingredients market size, by source, 2018-2032 (Tons)
- TABLE 48 Germany pesticide inert ingredients market size, by pesticides type, 2018-2032 (USD Million)
- TABLE 49 Germany pesticide inert ingredients market size, by pesticides type, 2018-2032 (Tons)
- TABLE 50 UK pesticide inert ingredients market size, by type, 2018-2032 (USD Million)
- TABLE 51 UK pesticide inert ingredients market size, by type, 2018-2032 (Tons)
- TABLE 52 UK pesticide inert ingredients market size, by source, 2018-2032 (USD Million)
- TABLE 53 UK pesticide inert ingredients market size, by source, 2018-2032 (Tons)
- TABLE 54 UK pesticide inert ingredients market size, by pesticides type, 2018-2032 (USD Million)
- TABLE 55 UK pesticide inert ingredients market size, by pesticides type, 2018-2032 (Tons)
- TABLE 56 France pesticide inert ingredients market size, by type, 2018-2032 (USD Million)
- TABLE 57 France pesticide inert ingredients market size, by type, 2018-2032 (Tons)
- TABLE 58 France pesticide inert ingredients market size, by source, 2018-2032 (USD Million)
- TABLE 59 France pesticide inert ingredients market size, by source, 2018-2032 (Tons)
- TABLE 60 France pesticide inert ingredients market size, by pesticides type, 2018-2032 (USD Million)
- TABLE 61 France pesticide inert ingredients market size, by pesticides type, 2018-2032 (Tons)
- TABLE 62 Spain pesticide inert ingredients market size, by type, 2018-2032 (USD Million)
- TABLE 63 Spain pesticide inert ingredients market size, by type, 2018-2032 (Tons)
- TABLE 64 Spain pesticide inert ingredients market size, by source, 2018-2032 (USD Million)
- TABLE 65 Spain pesticide inert ingredients market size, by source, 2018-2032 (Tons)
- TABLE 66 Spain pesticide inert ingredients market size, by pesticides type, 2018-2032 (USD Million)
- TABLE 67 Spain pesticide inert ingredients market size, by pesticides type, 2018-2032 (Tons)
- TABLE 68 Italy pesticide inert ingredients market size, by type, 2018-2032 (USD Million)
- TABLE 69 Italy pesticide inert ingredients market size, by type, 2018-2032 (Tons)
- TABLE 70 Italy pesticide inert ingredients market size, by source, 2018-2032 (USD Million)
- TABLE 71 Italy pesticide inert ingredients market size, by source, 2018-2032 (Tons)
- TABLE 72 Italy pesticide inert ingredients market size, by pesticides type, 2018-2032 (USD Million)
- TABLE 73 Italy pesticide inert ingredients market size, by pesticides type, 2018-2032 (Tons)
- TABLE 74 Asia Pacific pesticide inert ingredients market size, by country, 2018-2032 (USD Million)
- TABLE 75 Asia Pacific pesticide inert ingredients market size, by country, 2018-2032 (Tons)
- TABLE 76 Asia Pacific pesticide inert ingredients market size, by type, 2018-2032 (USD Million)
- TABLE 77 Asia Pacific pesticide inert ingredients market size, by type, 2018-2032 (Tons)
- TABLE 78 Asia Pacific pesticide inert ingredients market size, by source, 2018-2032 (USD Million)
- TABLE 79 Asia Pacific pesticide inert ingredients market size, by source, 2018-2032 (Tons)
- TABLE 80 Asia Pacific pesticide inert ingredients market size, by pesticides type, 2018-2032 (USD Million)
- TABLE 81 Asia Pacific pesticide inert ingredients market size, by pesticides type, 2018-2032 (Tons)
- TABLE 82 China pesticide inert ingredients market size, by type, 2018-2032 (USD Million)
- TABLE 83 China pesticide inert ingredients market size, by type, 2018-2032 (Tons)
- TABLE 84 China pesticide inert ingredients market size, by source, 2018-2032 (USD Million)
- TABLE 85 China pesticide inert ingredients market size, by source, 2018-2032 (Tons)
- TABLE 86 China pesticide inert ingredients market size, by pesticides type, 2018-2032 (USD Million)
- TABLE 87 China pesticide inert ingredients market size, by pesticides type, 2018-2032 (Tons)
- TABLE 88 Japan pesticide inert ingredients market size, by type, 2018-2032 (USD Million)
- TABLE 89 Japan pesticide inert ingredients market size, by type, 2018-2032 (Tons)
- TABLE 90 Japan pesticide inert ingredients market size, by source, 2018-2032 (USD Million)
- TABLE 91 Japan pesticide inert ingredients market size, by source, 2018-2032 (Tons)
- TABLE 92 Japan pesticide inert ingredients market size, by pesticides type, 2018-2032 (USD Million)
- TABLE 93 Japan pesticide inert ingredients market size, by pesticides type, 2018-2032 (Tons)
- TABLE 94 India pesticide inert ingredients market size, by type, 2018-2032 (USD Million)
- TABLE 95 India pesticide inert ingredients market size, by type, 2018-2032 (Tons)
- TABLE 96 India pesticide inert ingredients market size, by source, 2018-2032 (USD Million)
- TABLE 97 India pesticide inert ingredients market size, by source, 2018-2032 (Tons)
- TABLE 98 India pesticide inert ingredients market size, by pesticides type, 2018-2032 (USD Million)
- TABLE 99 India pesticide inert ingredients market size, by pesticides type, 2018-2032 (Tons)
- TABLE 100 Australia pesticide inert ingredients market size, by type, 2018-2032 (USD Million)
- TABLE 101 Australia pesticide inert ingredients market size, by type, 2018-2032 (Tons)
- TABLE 102 Australia pesticide inert ingredients market size, by source, 2018-2032 (USD Million)
- TABLE 103 Australia pesticide inert ingredients market size, by source, 2018-2032 (Tons)
- TABLE 104 Australia pesticide inert ingredients market size, by pesticides type, 2018-2032 (USD Million)
- TABLE 105 Australia pesticide inert ingredients market size, by pesticides type, 2018-2032 (Tons)
- TABLE 106 South Korea pesticide inert ingredients market size, by type, 2018-2032 (USD Million)
- TABLE 107 South Korea pesticide inert ingredients market size, by type, 2018-2032 (Tons)
- TABLE 108 South Korea pesticide inert ingredients market size, by source, 2018-2032 (USD Million)
- TABLE 109 South Korea pesticide inert ingredients market size, by source, 2018-2032 (Tons)
- TABLE 110 South Korea pesticide inert ingredients market size, by pesticides type, 2018-2032 (USD Million)
- TABLE 111 South Korea pesticide inert ingredients market size, by pesticides type, 2018-2032 (Tons)
- TABLE 112 Indonesia pesticide inert ingredients market size, by type, 2018-2032 (USD Million)
- TABLE 113 Indonesia pesticide inert ingredients market size, by type, 2018-2032 (Tons)
- TABLE 114 Indonesia pesticide inert ingredients market size, by source, 2018-2032 (USD Million)
- TABLE 115 Indonesia pesticide inert ingredients market size, by source, 2018-2032 (Tons)
- TABLE 116 Indonesia pesticide inert ingredients market size, by pesticides type, 2018-2032 (USD Million)
- TABLE 117 Indonesia pesticide inert ingredients market size, by pesticides type, 2018-2032 (Tons)
- TABLE 118 Malaysia pesticide inert ingredients market size, by type, 2018-2032 (USD Million)
- TABLE 119 Malaysia pesticide inert ingredients market size, by type, 2018-2032 (Tons)
- TABLE 120 Malaysia pesticide inert ingredients market size, by source, 2018-2032 (USD Million)
- TABLE 121 Malaysia pesticide inert ingredients market size, by source, 2018-2032 (Tons)
- TABLE 122 Malaysia pesticide inert ingredients market size, by pesticides type, 2018-2032 (USD Million)
- TABLE 123 Malaysia pesticide inert ingredients market size, by pesticides type, 2018-2032 (Tons)
- TABLE 124 Latin America pesticide inert ingredients market size, by country, 2018-2032 (USD Million)
- TABLE 125 Latin America pesticide inert ingredients market size, by country, 2018-2032 (Tons)
- TABLE 126 Latin America pesticide inert ingredients market size, by type, 2018-2032 (USD Million)
- TABLE 127 Latin America pesticide inert ingredients market size, by type, 2018-2032 (Tons)
- TABLE 128 Latin America pesticide inert ingredients market size, by source, 2018-2032 (USD Million)
- TABLE 129 Latin America pesticide inert ingredients market size, by source, 2018-2032 (Tons)
- TABLE 130 Latin America pesticide inert ingredients market size, by pesticides type, 2018-2032 (USD Million)
- TABLE 131 Latin America pesticide inert ingredients market size, by pesticides type, 2018-2032 (Tons)
- TABLE 132 Brazil pesticide inert ingredients market size, by type, 2018-2032 (USD Million)
- TABLE 133 Brazil pesticide inert ingredients market size, by type, 2018-2032 (Tons)
- TABLE 134 Brazil pesticide inert ingredients market size, by source, 2018-2032 (USD Million)
- TABLE 135 Brazil pesticide inert ingredients market size, by source, 2018-2032 (Tons)
- TABLE 136 Brazil pesticide inert ingredients market size, by pesticides type, 2018-2032 (USD Million)
- TABLE 137 Brazil pesticide inert ingredients market size, by pesticides type, 2018-2032 (Tons)
- TABLE 138 Mexico pesticide inert ingredients market size, by type, 2018-2032 (USD Million)
- TABLE 139 Mexico pesticide inert ingredients market size, by type, 2018-2032 (Tons)
- TABLE 140 Mexico pesticide inert ingredients market size, by source, 2018-2032 (USD Million)
- TABLE 141 Mexico pesticide inert ingredients market size, by source, 2018-2032 (Tons)
- TABLE 142 Mexico pesticide inert ingredients market size, by pesticides type, 2018-2032 (USD Million)
- TABLE 143 Mexico pesticide inert ingredients market size, by pesticides type, 2018-2032 (Tons)
- TABLE 144 Argentina pesticide inert ingredients market size, by type, 2018-2032 (USD Million)
- TABLE 145 Argentina pesticide inert ingredients market size, by type, 2018-2032 (Tons)
- TABLE 146 Argentina pesticide inert ingredients market size, by source, 2018-2032 (USD Million)
- TABLE 147 Argentina pesticide inert ingredients market size, by source, 2018-2032 (Tons)
- TABLE 148 Argentina pesticide inert ingredients market size, by pesticides type, 2018-2032 (USD Million)
- TABLE 149 Argentina pesticide inert ingredients market size, by pesticides type, 2018-2032 (Tons)
- TABLE 150 MEA pesticide inert ingredients market size, by country, 2018-2032 (USD Million)
- TABLE 151 MEA pesticide inert ingredients market size, by country, 2018-2032 (Tons)
- TABLE 152 MEA pesticide inert ingredients market size, by type, 2018-2032 (USD Million)
- TABLE 153 MEA pesticide inert ingredients market size, by type, 2018-2032 (Tons)
- TABLE 154 MEA pesticide inert ingredients market size, by source, 2018-2032 (USD Million)
- TABLE 155 MEA pesticide inert ingredients market size, by source, 2018-2032 (Tons)
- TABLE 156 MEA pesticide inert ingredients market size, by pesticides type, 2018-2032 (USD Million)
- TABLE 157 MEA pesticide inert ingredients market size, by pesticides type, 2018-2032 (Tons)
- TABLE 158 South Africa pesticide inert ingredients market size, by type, 2018-2032 (USD Million)
- TABLE 159 South Africa pesticide inert ingredients market size, by type, 2018-2032 (Tons)
- TABLE 160 South Africa pesticide inert ingredients market size, by source, 2018-2032 (USD Million)
- TABLE 161 South Africa pesticide inert ingredients market size, by source, 2018-2032 (Tons)
- TABLE 162 South Africa pesticide inert ingredients market size, by pesticides type, 2018-2032 (USD Million)
- TABLE 163 South Africa pesticide inert ingredients market size, by pesticides type, 2018-2032 (Tons)
- TABLE 164 Saudi Arabia pesticide inert ingredients market size, by type, 2018-2032 (USD Million)
- TABLE 165 Saudi Arabia pesticide inert ingredients market size, by type, 2018-2032 (Tons)
- TABLE 166 Saudi Arabia pesticide inert ingredients market size, by source, 2018-2032 (USD Million)
- TABLE 167 Saudi Arabia pesticide inert ingredients market size, by source, 2018-2032 (Tons)
- TABLE 168 Saudi Arabia pesticide inert ingredients market size, by pesticides type, 2018-2032 (USD Million)
- TABLE 169 Saudi Arabia pesticide inert ingredients market size, by pesticides type, 2018-2032 (Tons)
- TABLE 170 UAE pesticide inert ingredients market size, by type, 2018-2032 (USD Million)
- TABLE 171 UAE pesticide inert ingredients market size, by type, 2018-2032 (Tons)
- TABLE 172 UAE pesticide inert ingredients market size, by source, 2018-2032 (USD Million)
- TABLE 173 UAE pesticide inert ingredients market size, by source, 2018-2032 (Tons)
- TABLE 174 UAE pesticide inert ingredients market size, by pesticides type, 2018-2032 (USD Million)
- TABLE 175 UAE pesticide inert ingredients market size, by pesticides type, 2018-2032 (Tons)
- TABLE 176 Egypt pesticide inert ingredients market size, by type, 2018-2032 (USD Million)
- TABLE 177 Egypt pesticide inert ingredients market size, by type, 2018-2032 (Tons)
- TABLE 178 Egypt pesticide inert ingredients market size, by source, 2018-2032 (USD Million)
- TABLE 179 Egypt pesticide inert ingredients market size, by source, 2018-2032 (Tons)
- TABLE 180 Egypt pesticide inert ingredients market size, by pesticides type, 2018-2032 (USD Million)
- TABLE 181 Egypt pesticide inert ingredients market size, by pesticides type, 2018-2032 (Tons)
Charts & Figures
- FIG. 1 Industry segmentation
- FIG. 2 Market estimation and forecast methodology
- FIG. 3 Breakdown of primary participants
- FIG. 4 Pesticide inert ingredients industry, 360 degree synopsis, 2018 - 2032
- FIG. 5 Industry landscape, 2018-2032 (USD Million)
- FIG. 6 Growth potential analysis
- FIG. 7 Porter's analysis
- FIG. 8 PESTEL analysis
- FIG. 9 Company matrix analysis, 2022
- FIG. 10 Strategy dashboard, 2022
Pesticide Inert Ingredients Market size is set to expand at 3.9% CAGR from 2024 to 2032 driven by the increasing agriculture and food production demands.
The rapid expansion of the global population is surging the need for efficient pest control solutions to safeguard crop yields. Inert ingredients have become essential for enhancing the efficacy and stability of pesticide formulations as they ensure effective pest management while minimizing the environmental impacts. According to the World Trade Organization's most recent figures, India's agrochemical exports for fiscal year 2022-23 were $5.5 billion, overtaking the U.S. ($5.4 billion) to become the world's second-largest agrochemical exporter. The booming food production in tandem with the rising agricultural activities will add to the product uptake.
Furthermore, the rise in government endorsements, based on safety evaluations and efficacy assessments will bolster market confidence and foster innovations. For instance, in September 2023, the Ministry of Agriculture and Rural Affairs in China announced plans to approve 12 new pesticides, including Cyclobutrifluram and Flusulfinam. Such support is facilitating the introduction of novel formulations with enhanced performance for addressing the evolving pest management challenges, stimulating the market expansion.
The overall industry is segmented into type, pesticides type, source, and region.
Based on type, the bio-based pesticide inert ingredients market is set to attain 4.1% CAGR between 2024 and 2032 attributed to the ongoing shift towards eco-friendly pesticide formulations amid escalating environmental concerns. Bio-based inert ingredients, derived from renewable sources like plant extracts and microbial metabolites, offer effective alternatives with reduced environmental impact.
Regulatory support for sustainable agriculture and consumer demand for greener products will further drive the adoption of bio-based inert ingredients, further providing potential growth opportunities to the industry participants. For instance, in November 2023, FMC introduced a new insecticide/bio fungicide premix crop protection product, Ethos Elite LFR, for providing a broad range of control against early-season illnesses and soilborne pests in the U.S. market.
By pesticides type, the pesticide inert ingredients market from the insecticides segment is anticipated to record 4.1% CAGR from 2024-2032. Inert ingredients enhance the efficacy and stability of insecticide formulations for aiding in dispersing active ingredients, improving adhesion, and increasing insecticidal activity. With the escalating demand for pest control solutions to safeguard agricultural productivity and public health, the need for innovative inert ingredients in insecticides is rising. Moreover, rapid advancements in formulation technologies and regulatory requirements will contribute to the segment growth.
Regionally, the Europe pesticide inert ingredients industry is poised to expand at 4.2% growth rate during 2024-2032. The implementation of stringent regulations emphasizing environmental and human health safety is fueling the demand for inert ingredients to meet the regulatory standards in the region. The increasing focus on sustainable agriculture and integrated pest management in Europe is driving the product appeal. Additionally, the increasing consumer preference for eco-friendly products and organic farming practices will also propel the adoption of inert ingredients derived from natural sources, adding to the regional market expansion.
Table of Contents
Chapter 1 Methodology & Scope
- 1.1 Market scope & definition
- 1.2 Base estimates & calculations
- 1.3 Forecast parameters
- 1.4 Data sources
- 1.4.1 Primary
- 1.4.2 Secondary
- 1.4.2.1 Paid sources
- 1.4.2.2 Unpaid sources
Chapter 2 Executive Summary
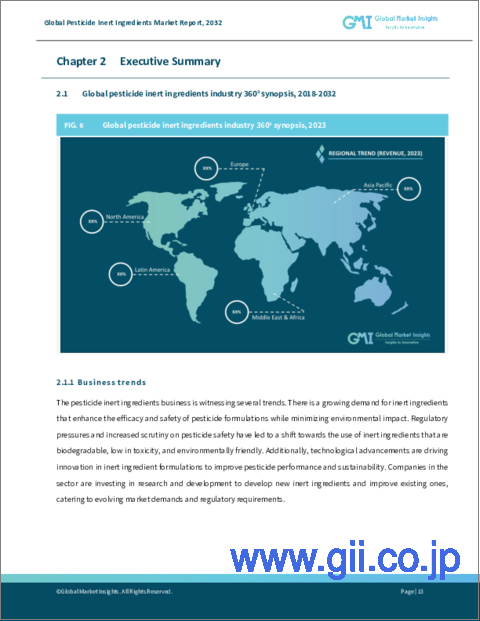
- 2.1 Pesticide inert ingredients industry 360 degree synopsis, 2018 - 2032
- 2.2 Business trends
- 2.3 Type trends
- 2.4 Source trends
- 2.5 Pesticides type trends
- 2.6 Regional trends
Chapter 3 Pesticide Inert Ingredients Industry Insights
- 3.1 Industry ecosystem analysis
- 3.2 Industry impact forces
- 3.2.1 Growth drivers
- 3.2.2 Industry pitfalls & challenges
- 3.3 Growth potential analysis
- 3.4 Regulatory landscape
- 3.4.1 U.S.
- 3.4.2 Europe
- 3.5 Pricing analysis, 2022
- 3.6 Technology landscape
- 3.6.1 Future market trends
- 3.7 Porter's analysis
- 3.8 PESTEL analysis
Chapter 4 Competitive Landscape, 2022
- 4.1 Introduction
- 4.2 Global company market share analysis, 2022
- 4.2.1 Regional company market share analysis 2022
- 4.3 Competitive analysis
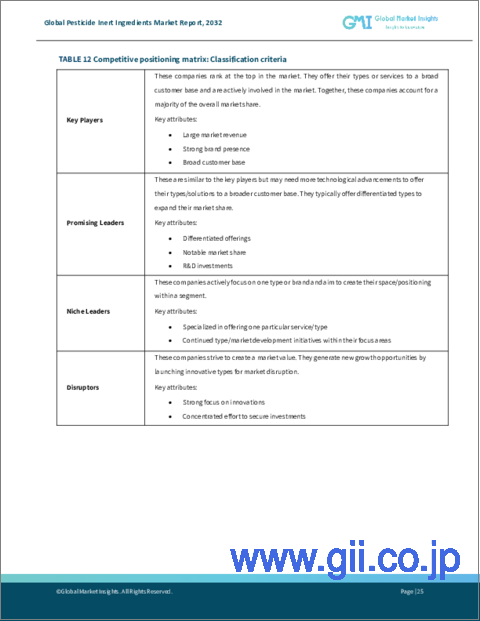
- 4.4 Competitive positioning matrix
- 4.5 Strategy dashboard
Chapter 5 Pesticide Inert Ingredients Market Size and Forecast, By Type 2018 - 2032
- 5.1 Pesticide inert ingredients market trends, by type
- 5.2 Emulsifiers
- 5.3 Solvents
- 5.4 Carriers
- 5.5 Others
Chapter 6 Pesticide Inert Ingredients Market Size and Forecast, By Source 2018 - 2032
- 6.1 Pesticide inert ingredients market trends, by source
- 6.2 Synthetic
- 6.3 Bio-based
Chapter 7 Pesticide Inert Ingredients Market Size and Forecast, By Pesticides Type 2018 - 2032
- 7.1 Pesticide inert ingredients market trends, by pesticides type
- 7.2 Herbicides
- 7.3 Insecticides
- 7.4 Fungicides
- 7.5 Rodenticides
- 7.6 Others
Chapter 8 Pesticide Inert Ingredients Market Size and Forecast, By Region 2018 - 2032
- 8.1 Key trends, by region
- 8.2 North America
- 8.2.1 U.S.
- 8.2.2 Canada
- 8.3 Europe
- 8.3.1 Germany
- 8.3.2 UK
- 8.3.3 France
- 8.3.4 Spain
- 8.3.5 Italy
- 8.4 Asia Pacific
- 8.4.1 Japan
- 8.4.2 China
- 8.4.3 India
- 8.4.4 Australia
- 8.4.5 South Korea
- 8.4.6 Indonesia
- 8.4.7 Malaysia
- 8.5 Latin America
- 8.5.1 Brazil
- 8.5.2 Mexico
- 8.5.3 Argentina
- 8.6 MEA
- 8.6.1 South Africa
- 8.6.2 Saudi Arabia
- 8.6.3 UAE
- 8.6.4 Egypt
Chapter 9 Company Profiles
- 9.1 BASF SE
- 9.2 DowDuPont
- 9.3 Clariant AG
- 9.4 Croda International Plc
- 9.5 Solvay SA
- 9.6 Stepan Company
- 9.7 Evonik Industries AG
- 9.8 Royal Dutch Shell plc
- 9.9 LyondellBasell Industries N.V.
- 9.10 Huntsman Corporation
- 9.11 Eastman Chemical Company
- 9.12 AkzoNobel
- 9.13 Lonza Group Ltd.
- 9.14 Wacker Chemie AG
- 9.15 Albemarle Corporation
