|
|
市場調査レポート
商品コード
1666899
スチレン系ポリマーの市場機会、成長促進要因、産業動向分析、2025~2034年予測Styrenic Polymers Market Opportunity, Growth Drivers, Industry Trend Analysis, and Forecast 2025 - 2034 |
||||||
|
|||||||
カスタマイズ可能
|
|||||||

| スチレン系ポリマーの市場機会、成長促進要因、産業動向分析、2025~2034年予測 |
|
出版日: 2024年12月31日
発行: Global Market Insights Inc.
ページ情報: 英文 200 Pages
納期: 2~3営業日
|

全表示
- 概要
- 目次
スチレン系ポリマーの世界市場規模は2024年に41億2,000万米ドルとなり、2025年から2034年にかけてCAGR 5.8%で成長すると予測されています。
スチレンに由来するこれらのポリマーは、汎用性の高さで知られる費用対効果の高いプラスチックの重要なグループです。アモルファス構造であるため高温での加工が容易で、軟化点を超えるため、他の半結晶性ポリマーに比べて取り扱いが容易です。他のポリマーとは異なり、スチレン系ポリマーには明確な融点がないため、加工時間が短縮され、機械的特性が向上します。

スチレン系ポリマーは、包装、消費財、電子機器、自動車部品、さらにはボートなど、さまざまな産業で使用されています。これらのポリマーは、軽量で耐久性に優れ、多くの用途に理想的な製品を製造できることから重宝されており、特に包装分野では優れた成形特性を発揮します。また、手頃な価格と適応性により、ヘルスケア、スポーツ、レジャー、パーソナルケアなどの分野で不可欠な存在となっています。
| 市場範囲 | |
|---|---|
| 開始年 | 2024年 |
| 予測年 | 2025~2034年 |
| 開始金額 | 41億2,000万米ドル |
| 予測金額 | 73億4,000万米ドル |
| CAGR | 5.8% |
スチレン系ポリマーは軽量で耐久性に優れ、燃費と総合性能の向上に貢献するため、自動車・輸送分野では特にその恩恵を受けています。建築・建設分野では、断熱材、配管、その他の構造部品に不可欠な材料です。その多用途性により、さまざまな産業で世界的に一定の需要が確保されています。
しかし、特定のスチレン系ポリマー、特にポリスチレンの場合、生分解性に関連する環境問題が市場に大きな課題をもたらしています。このため、規制が強化され、消費者の嗜好もより持続可能な代替品へとシフトしています。メーカーは現在、進化する規制に対応する必要性に取り組んでおり、市場成長を鈍化させる可能性があります。
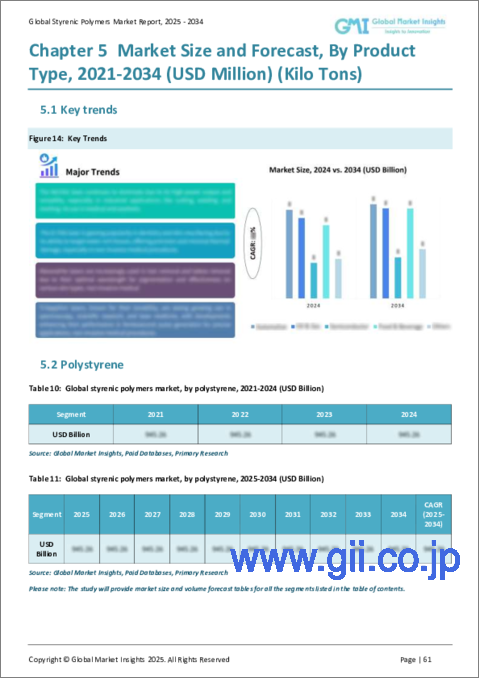
2024年には、ポリスチレンがスチレン系ポリマー市場で最大のシェアを占め、その市場規模は24億1,000万米ドルで、予測期間中のCAGRは5.4%と予測されます。この硬質で汎用性の高いポリマーは、低コストで加工が容易なため、包装や、高品質でコスト効率の高い材料を必要とするその他の産業で好まれています。
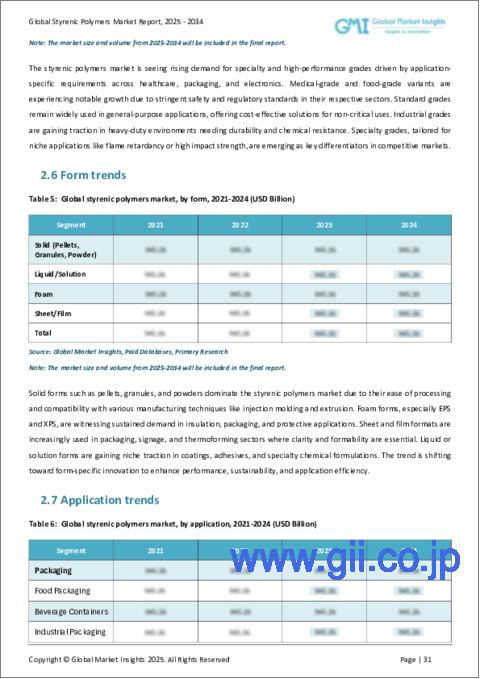
包装分野は依然としてスチレン系ポリマー市場最大の最終用途分野であり、2024年の市場規模は12億5,000万米ドルです。この市場は、汎用性の高い包装材料への需要が高まり続けていることから、予測期間中にCAGR 5.5%で成長するとみられています。スチレン系ポリマーは強度、成形性、透明性で高く評価されており、多様な包装用途に選ばれる材料となっています。
アジア太平洋地域、特に中国はスチレン系ポリマー市場で力強い成長を遂げており、2024年の評価額は7億3,070万米ドルを超えます。工業化と都市化が急速に進み、中産階級が増加していることが、消費財、包装、建設資材の需要を牽引しています。スチレン系ポリマーは様々な自動車部品に広く使用されているため、この地域の自動車産業が盛んであることも、成長に大きく寄与しています。
目次
第1章 調査手法と調査範囲
- 市場範囲と定義
- 基本推定と計算
- 予測計算
- データソース
- 1次データ
- 二次資料
- 有料情報源
- 公的情報源
第2章 エグゼクティブサマリー
第3章 業界洞察
- エコシステム分析
- バリューチェーンに影響を与える要因
- 利益率分析
- 変革
- 将来展望
- メーカー
- 流通業者
- サプライヤーの状況
- 利益率分析
- 主要ニュースと取り組み
- 規制状況
- 影響要因
- 促進要因
- 軽量で持続可能な素材への需要の高まり
- 消費財および包装需要の増加
- 業界の潜在的リスク&課題
- 環境への懸念と規制圧力
- 促進要因
- 成長可能性分析
- ポーター分析
- PESTEL分析
第4章 競合情勢
- イントロダクション
- 企業シェア分析
- 競合のポジショニングマトリックス
- 戦略展望マトリックス
第5章 市場規模・予測:製品別、2021~2034年
- 主要動向
- ポリスチレン
- ABS
- SAN
- MBS
- MABS
- SMMA
- SBS
- SEBS
- その他
第6章 市場規模・予測:最終用途別、2021~2034年
- 主要動向
- 自動車・輸送
- 建築・建設
- 包装
- 消費財
- 医療
- スポーツ&レジャー
- パーソナルケア
第7章 市場規模・予測:地域別、2021~2034年
- 主要動向
- 北米
- 米国
- カナダ
- 欧州
- 英国
- ドイツ
- フランス
- イタリア
- スペイン
- ロシア
- アジア太平洋
- 中国
- インド
- 日本
- 韓国
- オーストラリア
- ラテンアメリカ
- ブラジル
- メキシコ
- 中東・アフリカ
- 南アフリカ
- サウジアラビア
- アラブ首長国連邦
第8章 企業プロファイル
- Asahi Kasei Corporation
- BASF
- China Petroleum &Chemical Corporation(Sinopec)
- Dow Chemical Company
- INEOS Styrolution Group
- LG Chem
- PTT Global Chemical Public Company Limited
- Sumitomo Chemical Company, Limited
- Trinseo
The Global Styrenic Polymers Market was valued at USD 4.12 billion in 2024 and is projected to grow at a CAGR of 5.8% between 2025 and 2034. These polymers, derived from styrene, are an essential group of cost-effective plastics known for their versatility. Their amorphous structure allows them to be easily processed at high temperatures, surpassing their softening point, which makes them easier to handle compared to other semi-crystalline polymers. Unlike others, styrenic polymers don't have a clear melting point, offering faster processing times and enhanced mechanical properties.
Styrenic polymers are used in a wide variety of industries, including packaging, consumer goods, electronics, automotive parts, and even boats. These polymers are prized for their ability to create lightweight, durable products ideal for many applications, particularly in packaging, where they provide excellent molding properties. Their widespread use is also attributed to their affordability and adaptability, making them indispensable in sectors like healthcare, sports, leisure, and personal care.
| Market Scope | |
|---|---|
| Start Year | 2024 |
| Forecast Year | 2025-2034 |
| Start Value | $4.12 Billion |
| Forecast Value | $7.34 Billion |
| CAGR | 5.8% |
The automotive and transportation sectors particularly benefit from the use of styrenic polymers due to their lightweight and durable nature, which contributes to improved fuel efficiency and overall performance. In building and construction, these materials are integral for insulation, piping, and other structural components. Their versatility has ensured a constant global demand across various industries.
However, environmental concerns related to the biodegradability of certain styrenic polymers, particularly in the case of polystyrene, present significant challenges for the market. This has led to stricter regulatory pressures and a shift in consumer preferences toward more sustainable alternatives. Manufacturers are now grappling with the need to meet evolving regulations, which could potentially slow market growth.
In 2024, polystyrene held the largest share of the styrenic polymers market, valued at USD 2.41 billion, with a projected CAGR of 5.4% during the forecast period. This rigid and versatile polymer is favored for its low cost and ease of processing, making it popular in packaging and other industries that require high-quality, cost-efficient materials.
Packaging remains the largest end-use segment of the styrenic polymers market, valued at USD 1.25 billion in 2024. This market is set to grow at a CAGR of 5.5% during the forecast period as the demand for versatile packaging materials continues to rise. Styrenic polymers are highly regarded for their strength, moldability, and transparency, which makes them the material of choice for diverse packaging applications.
The Asia-Pacific region, particularly China, is experiencing robust growth in the styrenic polymers market, with a valuation surpassing USD 730.7 million in 2024. The rapid pace of industrialization and urbanization, coupled with a growing middle class, is driving demand for consumer goods, packaging, and construction materials. The region's flourishing automotive sector is also a significant factor contributing to this growth, as styrenic polymers are widely used in various automotive components.
Table of Contents
Chapter 1 Methodology & Scope
- 1.1 Market scope & definition
- 1.2 Base estimates & calculations
- 1.3 Forecast calculation
- 1.4 Data sources
- 1.4.1 Primary
- 1.4.2 Secondary
- 1.4.2.1 Paid sources
- 1.4.2.2 Public sources
Chapter 2 Executive Summary
- 2.1 Industry synopsis, 2021-2034
Chapter 3 Industry Insights
- 3.1 Industry ecosystem analysis
- 3.1.1 Factor affecting the value chain
- 3.1.2 Profit margin analysis
- 3.1.3 Disruptions
- 3.1.4 Future outlook
- 3.1.5 Manufacturers
- 3.1.6 Distributors
- 3.2 Supplier landscape
- 3.3 Profit margin analysis
- 3.4 Key news & initiatives
- 3.5 Regulatory landscape
- 3.6 Impact forces
- 3.6.1 Growth drivers
- 3.6.1.1 Increasing demand for lightweight and sustainable materials
- 3.6.1.2 Rising consumer goods and packaging demands
- 3.6.2 Industry pitfalls & challenges
- 3.6.2.1 Environmental concerns and regulatory pressures
- 3.6.1 Growth drivers
- 3.7 Growth potential analysis
- 3.8 Porter’s analysis
- 3.9 PESTEL analysis
Chapter 4 Competitive Landscape, 2024
- 4.1 Introduction
- 4.2 Company market share analysis
- 4.3 Competitive positioning matrix
- 4.4 Strategic outlook matrix
Chapter 5 Market Size and Forecast, By Product, 2021-2034 (USD Million) (Kilo Tons)
- 5.1 Key trends
- 5.2 Polystyrene
- 5.3 ABS
- 5.4 SAN
- 5.5 MBS
- 5.6 MABS
- 5.7 SMMA
- 5.8 SBS
- 5.9 SEBS
- 5.10 Others
Chapter 6 Market Size and Forecast, By End Use, 2021-2034 (USD Million) (Kilo Tons)
- 6.1 Key trends
- 6.2 Automotive & transportation
- 6.3 Building & construction
- 6.4 Packaging
- 6.5 Consumer goods
- 6.6 Medical
- 6.7 Sports & leisure
- 6.8 Personal care
Chapter 7 Market Size and Forecast, By Region, 2021-2034 (USD Million) (Kilo Tons)
- 7.1 Key trends
- 7.2 North America
- 7.2.1 U.S.
- 7.2.2 Canada
- 7.3 Europe
- 7.3.1 UK
- 7.3.2 Germany
- 7.3.3 France
- 7.3.4 Italy
- 7.3.5 Spain
- 7.3.6 Russia
- 7.4 Asia Pacific
- 7.4.1 China
- 7.4.2 India
- 7.4.3 Japan
- 7.4.4 South Korea
- 7.4.5 Australia
- 7.5 Latin America
- 7.5.1 Brazil
- 7.5.2 Mexico
- 7.6 MEA
- 7.6.1 South Africa
- 7.6.2 Saudi Arabia
- 7.6.3 UAE
Chapter 8 Company Profiles
- 8.1 Asahi Kasei Corporation
- 8.2 BASF
- 8.3 China Petroleum & Chemical Corporation (Sinopec)
- 8.4 Dow Chemical Company
- 8.5 INEOS Styrolution Group
- 8.6 LG Chem
- 8.7 PTT Global Chemical Public Company Limited
- 8.8 Sumitomo Chemical Company, Limited
- 8.9 Trinseo

