
|
市場調査レポート
商品コード
1766343
業務用配電盤の市場機会、成長促進要因、産業動向分析、2025年~2034年予測Commercial Distribution Panel Market Opportunity, Growth Drivers, Industry Trend Analysis, and Forecast 2025 - 2034 |
||||||
カスタマイズ可能
|
|||||||
| 業務用配電盤の市場機会、成長促進要因、産業動向分析、2025年~2034年予測 |
|
出版日: 2025年06月12日
発行: Global Market Insights Inc.
ページ情報: 英文 190 Pages
納期: 2~3営業日
|

全表示
- 概要
- 目次
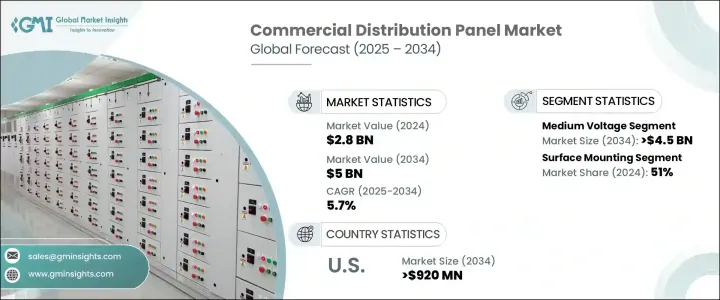
業務用配電盤の世界市場規模は、2024年に28億米ドルとなり、CAGR 5.7%で成長し、2034年には50億米ドルに達すると予測されています。
この成長の原動力は、商業インフラにおける効率的なエネルギー分配システムに対するニーズの高まりです。この成長は、特に新興経済諸国における都市景観の拡大と商業施設の急速な開発によって大きく後押しされています。企業は、合理的なエネルギー使用と信頼性の高い電力制御を重視するようになっており、その結果、高度な配電ソリューションに対する需要が高まっています。
都市が発展し商業ビルが増加するにつれ、配電システムはより堅牢で適応性の高いものに進化しています。商業部門では、リアルタイムのエネルギー監視と運用効率の向上を可能にするスマート技術の採用が進んでいます。自動化されたシステム、インテリジェントな故障検出、遠隔監視はもはやオプションではなく、新しい設備に不可欠な機能となりつつあります。このような技術革新は、さまざまな業界でエネルギー管理のスマート化が進んでいることを反映しています。開発企業は、商業施設の開発者、施設管理者、テナントの現代的な期待に応えるため、エネルギー効率の高い設計とデジタル接続を優先しています。
| 市場範囲 | |
|---|---|
| 開始年 | 2024年 |
| 予測年 | 2025年~2034年 |
| 開始金額 | 28億米ドル |
| 予測金額 | 50億米ドル |
| CAGR | 5.7% |
並行して、エネルギー効率と環境コンプライアンスに焦点を当てた規制の枠組みが、市場全体の力学に影響を及ぼしています。企業は、エネルギーを効率的に分配するだけでなく、持続可能性の目標にも貢献するパネルに投資することで、こうした進化する基準に適応しています。建物の性能や安全基準に対する期待の高まりも、古いシステムのアップグレードを促しています。その結果、商業施設全体のエネルギー・インフラは、継続的な製品開発と標準化に支えられながら、急速な変貌を遂げつつあります。
サプライチェーンの変化や地域政策の変化は、企業に価格戦略や流通チャネルの見直しを促しています。こうした外部からの影響により、市場プレーヤーは戦略的提携を結び、合併を行い、世界の事業拡大を図っています。こうした動きは、成長市場での存在感を高め、複雑な地域特有のエネルギー配給ニーズに対応する上で極めて重要です。
製品タイプの中では、中電圧セグメントが大きな成長の可能性を秘めており、2034年までに45億米ドルを超えると予測されています。このセグメントの成長は、信頼性の高い大容量配電を必要とする商業ビル、製造施設、データセンターの増加に起因しています。これらの施設には高度な機械やデジタルインフラが組み込まれているため、正確なエネルギー制御と安全性を提供する高圧パネルの必要性がさらに高まっています。また、モノのインターネット(IoT)機能やスマートグリッドとの互換性が統合されたことで、事業者がエネルギー性能をリアルタイムで遠隔監視・最適化できるようになり、このセグメントの関連性が強まっています。
設置タイプは引き続き市場全体の需要動向を形成しています。表面設置型配電パネルは、2024年の世界市場シェアの約51%を占め、2034年まで5%以上の成長率が見込まれています。これらのパネルは、設置が簡単でアクセスしやすいため、特に産業用や公益事業用の環境で好まれています。改修や頻繁なメンテナンスが必要な場面でも実用的な利点を提供するため、混乱を最小限に抑え、アクセスを容易にすることを目指す商業施設に好まれます。
地域別では、米国が依然として業務用配電盤の主要市場です。米国の市場規模は、2022年に5億220万米ドル、2023年に5億4,120万米ドル、2024年に5億7,960万米ドルとなりました。2034年には9億2,000万米ドルを超えると予測されています。この成長を支えているのは、スマートビルへの投資の増加、老朽化した電気システムのアップグレード、エネルギー効率の高い商業スペースへの幅広いシフトです。ビルオートメーションやデジタル監視システムの普及に伴い、インテリジェントで応答性の高い配電盤へのニーズは高まり続けています。
市場競争の面では、少数の企業グループが世界の売上を独占しています。2024年には、上位5社(シュナイダーエレクトリック、シーメンス、ABB、イートン、ルグラン)が市場全体の35%以上を占める。これらの企業は、技術革新、信頼性、確立された顧客関係により、市場で確固たる地位を維持しています。複雑な商業要件に合わせてカスタマイズされたソリューションを提供する能力は、世界市場での地位をさらに強化しています。業界の進化に伴い、これらの企業は、スマートで拡張性があり、未来に対応した配電システムを提供することで、業界をリードしていくと予想されます。
目次
第1章 調査手法と範囲
第2章 エグゼクティブサマリー
第3章 業界考察
- エコシステム分析
- 規制情勢
- 業界への影響要因
- 促進要因
- 業界の潜在的リスク&課題
- 成長可能性分析
- ポーター分析
- PESTEL分析
第4章 競合情勢
- イントロダクション
- 企業の市場シェア分析
- 戦略的取り組み
- 戦略的ダッシュボード
- 競合ベンチマーキング
- イノベーションとテクノロジーの情勢
第5章 市場規模・予測:電圧別、2021年~2034年
- 主要動向
- 低電圧
- 中電圧
第6章 市場規模・予測:設置別、2021年~2034年
- 主要動向
- フラッシュマウント
- 表面実装
第7章 市場規模・予測:最終用途別、2021年~2034年
- 主要動向
- 大学
- オフィス
- 政府/軍
- その他
第8章 市場規模・予測:地域別、2021年~2034年
- 主要動向
- 北米
- 米国
- カナダ
- 欧州
- 英国
- フランス
- ドイツ
- ロシア
- イタリア
- アジア太平洋
- 中国
- オーストラリア
- インド
- 日本
- 韓国
- 中東・アフリカ
- サウジアラビア
- アラブ首長国連邦
- カタール
- 南アフリカ
- エジプト
- ラテンアメリカ
- ブラジル
- アルゼンチン
- メキシコ
第9章 企業プロファイル
- ABB
- Abunayyan Holding
- Ags
- Alfanar
- CSE Solutions
- Eaton
- EAMFCO
- ESL Power Systems
- General Electric
- Hager
- Industrial Electric MFG
- Larsen &Toubro
- Legrand
- Meba Electric
- NHP
- Norelco
- Paneltronics
- RBaker
- Schneider Electric
- Siemens
- Symbiotic Systems
The Global Commercial Distribution Panel Market was valued at USD 2.8 billion in 2024 and is estimated to grow at a CAGR of 5.7% to reach USD 5 billion by 2034. This growth is driven by the rising need for efficient energy distribution systems in commercial infrastructure. This growth is largely fueled by the expanding urban landscape and rapid development of commercial facilities, especially in emerging economies. Businesses are placing greater emphasis on streamlined energy usage and reliable power control, which in turn is elevating the demand for advanced distribution solutions.
As cities grow and commercial buildings multiply, power distribution systems are evolving to become more robust and adaptable. The commercial sector is increasingly adopting smart technologies that allow for real-time energy monitoring and enhanced operational efficiency. Automated systems, intelligent fault detection, and remote supervision are no longer optional-they are becoming essential features in new installations. These innovations reflect a broader shift toward smarter energy management practices across various industries. Companies are prioritizing energy-efficient designs and digital connectivity to meet the modern expectations of commercial property developers, facility managers, and tenants.
| Market Scope | |
|---|---|
| Start Year | 2024 |
| Forecast Year | 2025-2034 |
| Start Value | $2.8 Billion |
| Forecast Value | $5 Billion |
| CAGR | 5.7% |
In parallel, regulatory frameworks focused on energy efficiency and environmental compliance are influencing the overall market dynamics. Businesses are adapting to these evolving standards by investing in panels that not only distribute energy effectively but also contribute to sustainability goals. Rising expectations around building performance and safety standards are also prompting upgrades to older systems. As a result, energy infrastructure across commercial properties is undergoing rapid transformation, supported by continuous product development and standardization.
Changing supply chain landscapes and shifting regional policies are prompting companies to rethink pricing strategies and distribution channels. These external influences are encouraging market players to form strategic alliances, engage in mergers, and expand their global reach. Such moves are crucial for enhancing their presence in growing markets and for addressing complex, region-specific energy distribution needs.
Among product types, the medium voltage segment holds significant growth potential and is projected to surpass USD 4.5 billion by 2034. This segment's rise can be attributed to the increasing number of commercial buildings, manufacturing facilities, and data centers requiring reliable and high-capacity power distribution. As these facilities incorporate sophisticated machinery and digital infrastructure, the need for medium voltage panels that offer precise energy control and safety becomes even more vital. The integration of Internet of Things (IoT) capabilities and smart grid compatibility is also strengthening this segment's relevance, as it allows operators to remotely monitor and optimize energy performance in real time.
Installation types continue to shape demand trends across the market. Surface-mounted distribution panels accounted for approximately 51% of global market share in 2024 and are expected to grow at a rate of more than 5% through 2034. These panels are favored for their straightforward installation and accessibility, particularly in industrial and utility settings. They offer practical benefits in scenarios where retrofitting or frequent maintenance is required, making them a preferred choice for commercial facilities aiming for minimal disruption and ease of access.
Regionally, the United States remains a key market for commercial distribution panels. The U.S. market was valued at USD 502.2 million in 2022, USD 541.2 million in 2023, and USD 579.6 million in 2024. By 2034, it is anticipated to exceed USD 920 million. This growth is supported by increased investments in smart buildings, upgrades to aging electrical systems, and the broader shift toward energy-efficient commercial spaces. As building automation and digital surveillance systems gain traction, the need for intelligent and responsive distribution panels continues to grow.
In terms of market competition, a small group of companies dominates global sales. In 2024, the top five manufacturers-Schneider Electric, Siemens, ABB, Eaton, and Legrand-accounted for more than 35% of the overall market. These companies maintain strong market positions due to their technological innovation, reliability, and established customer relationships. Their ability to deliver customized solutions tailored to complex commercial requirements further strengthens their standing in the global market. As the industry evolves, these players are expected to lead the way in offering smart, scalable, and future-ready distribution systems.
Table of Contents
Chapter 1 Methodology & Scope
- 1.1 Market definitions
- 1.2 Base estimates & calculations
- 1.3 Forecast calculation
- 1.4 Data sources
- 1.4.1 Primary
- 1.4.2 Secondary
- 1.4.2.1 Paid
- 1.4.2.2 Public
Chapter 2 Executive Summary
- 2.1 Industry synopsis, 2021 - 2034
Chapter 3 Industry Insights
- 3.1 Industry ecosystem analysis
- 3.2 Regulatory landscape
- 3.3 Industry impact forces
- 3.3.1 Growth drivers
- 3.3.2 Industry pitfalls & challenges
- 3.4 Growth potential analysis
- 3.5 Porter's analysis
- 3.5.1 Bargaining power of suppliers
- 3.5.2 Bargaining power of buyers
- 3.5.3 Threat of new entrants
- 3.5.4 Threat of substitutes
- 3.6 PESTEL analysis
Chapter 4 Competitive landscape, 2025
- 4.1 Introduction
- 4.2 Company market share analysis, 2024
- 4.3 Strategic initiatives
- 4.4 Strategic dashboard
- 4.5 Competitive benchmarking
- 4.6 Innovation & technology landscape
Chapter 5 Market Size and Forecast, By Voltage, 2021 - 2034 (USD Million)
- 5.1 Key trends
- 5.2 Low voltage
- 5.3 Medium voltage
Chapter 6 Market Size and Forecast, By Mounting, 2021 - 2034 (USD Million)
- 6.1 Key trends
- 6.2 Flush mounting
- 6.3 Surface mounting
Chapter 7 Market Size and Forecast, By End Use, 2021 - 2034 (USD Million)
- 7.1 Key trends
- 7.2 College/university
- 7.3 Office
- 7.4 Government/military
- 7.5 Others
Chapter 8 Market Size and Forecast, By Region, 2021 - 2034 (USD Million)
- 8.1 Key trends
- 8.2 North America
- 8.2.1 U.S.
- 8.2.2 Canada
- 8.3 Europe
- 8.3.1 UK
- 8.3.2 France
- 8.3.3 Germany
- 8.3.4 Russia
- 8.3.5 Italy
- 8.4 Asia Pacific
- 8.4.1 China
- 8.4.2 Australia
- 8.4.3 India
- 8.4.4 Japan
- 8.4.5 South Korea
- 8.5 Middle East & Africa
- 8.5.1 Saudi Arabia
- 8.5.2 UAE
- 8.5.3 Qatar
- 8.5.4 South Africa
- 8.5.5 Egypt
- 8.6 Latin America
- 8.6.1 Brazil
- 8.6.2 Argentina
- 8.6.3 Mexico
Chapter 9 Company Profiles
- 9.1 ABB
- 9.2 Abunayyan Holding
- 9.3 Ags
- 9.4 Alfanar
- 9.5 CSE Solutions
- 9.6 Eaton
- 9.7 EAMFCO
- 9.8 ESL Power Systems
- 9.9 General Electric
- 9.10 Hager
- 9.11 Industrial Electric MFG
- 9.12 Larsen & Toubro
- 9.13 Legrand
- 9.14 Meba Electric
- 9.15 NHP
- 9.16 Norelco
- 9.17 Paneltronics
- 9.18 RBaker
- 9.19 Schneider Electric
- 9.20 Siemens
- 9.21 Symbiotic Systems

