
|
市場調査レポート
商品コード
1892767
鉱業向けセンサーベース選別機の市場の機会、成長要因、業界動向分析、および2026年~2035年予測Sensor Based Sorting Machines for Mining Market Opportunity, Growth Drivers, Industry Trend Analysis, and Forecast 2026 - 2035 |
||||||
カスタマイズ可能
|
|||||||
| 鉱業向けセンサーベース選別機の市場の機会、成長要因、業界動向分析、および2026年~2035年予測 |
|
出版日: 2025年12月12日
発行: Global Market Insights Inc.
ページ情報: 英文 250 Pages
納期: 2~3営業日
|

概要
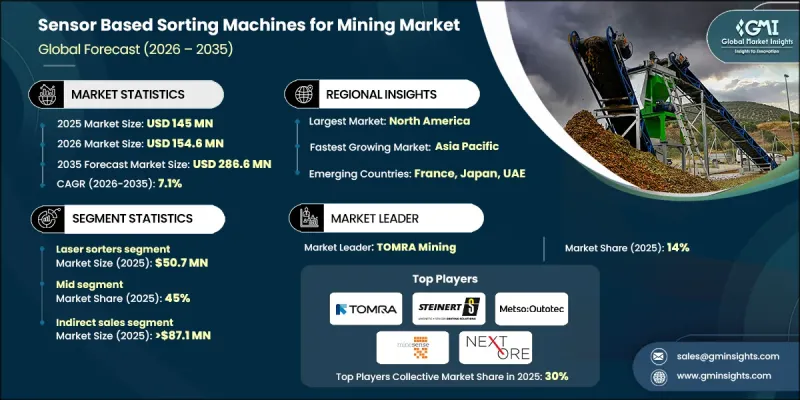
世界の鉱業向けセンサーベース選別機市場は、2025年に1億4,500万米ドルと評価され、2035年までにCAGR 7.1%で成長し、2億8,660万米ドルに達すると予測されています。
市場成長は、インフラ拡張、加速する都市開発、進行中のエネルギー転換に支えられた、ベースメタル、貴金属、工業用鉱物に対する世界の需要の高まりによって牽引されています。こうした構造的変化により銅やニッケルなどの材料需要が増加し、結果として採掘量全体が拡大しています。生産規模が拡大する中、鉱山事業者は効率向上と廃棄物発生抑制の両立が求められています。センサーベースの選別技術は、鉱石の初期段階における事前濃縮を可能にし、下流工程前に有価物を分離することを実現します。これにより回収率が向上し、エネルギーと水の使用量を削減することで環境負荷を低減します。鉱業活動が低品位鉱床や地理的に遠隔な地域へ移行するにつれ、従来の選鉱方法はより複雑かつ高コスト化しています。センサー駆動型選別技術は、不要な材料移動を最小限に抑え、粉砕工程への負荷を軽減する選択的処理を可能にします。これらのシステムは、より厳しい持続可能性目標に沿いながら総合的な生産性向上を支援し、効率性、コスト管理、環境責任に焦点を当てた現代の鉱業運営において、センサーベース選別を中核技術として位置づけています。
| 市場範囲 | |
|---|---|
| 開始年 | 2025年 |
| 予測年度 | 2026-2035 |
| 開始時価値 | 1億4,500万米ドル |
| 予測金額 | 2億8,660万米ドル |
| CAGR | 7.1% |
レーザー選別機セグメントは2025年に5,070万米ドルの収益を生み出しました。これらのシステムは、表面特性や組成特性を用いて鉱石粒子を評価する高度なレーザーベースのセンシング技術に依存しています。鉱物の組織、反射率、元素組成を分析することで、レーザー選別は密度や色に基づく方法よりも高い選別精度を実現します。この分析能力は、高エネルギーパルスが測定可能なスペクトルを生成し、鉱物特性を精密に識別するレーザー誘起破壊分光法によって達成されます。
中容量システムセグメントは2025年に45%のシェアを占めました。これらの機械は通常、1時間あたり150~350トンを処理し、小型モジュールユニットと本格的な産業用設備の中間に位置します。主に一次または二次前選別に導入され、下流工程を妨げずに安定した処理能力を維持するよう設計されています。粉砕前の廃棄物除去、試薬消費量の削減、供給変動の安定化に貢献します。
米国の鉱業向けセンサーベース選別機市場は、2025年に75.6%のシェアを占め、1億960万米ドルの収益を生み出しました。活発な鉱業活動、先進的な操業インフラ、生産性最適化への注力が市場リーダーシップを支えています。同国の鉱業事業者は、環境影響を最小限に抑えつつ資源利用率を向上させるため、センサーベース技術を広く採用しています。
よくあるご質問
目次
第1章 調査手法と範囲
第2章 エグゼクティブサマリー
第3章 業界考察
- エコシステム分析
- サプライヤーの情勢
- 利益率
- 各段階における付加価値
- バリューチェーンに影響を与える要因
- 業界への影響要因
- 促進要因
- 鉱業活動の増加
- 運用コスト削減
- 重要鉱物への需要
- 業界の潜在的リスク&課題
- 初期投資コストの高さ
- 統合の複雑さ
- 機会
- 自動化とAIの統合
- カスタマイズされたセンサーソリューション
- 促進要因
- 成長可能性分析
- 将来の市場動向
- 技術とイノベーションの動向
- 現在の技術動向
- 新興技術
- 価格動向
- 地域別
- オペレーティングシステム別
- 規制情勢
- 規格およびコンプライアンス要件
- 地域別規制枠組み
- 認証基準
- ポーター分析
- PESTEL分析
第4章 競合情勢
- イントロダクション
- 企業の市場シェア分析
- 地域別
- 企業マトリクス分析
- 主要市場企業の競合分析
- 競合ポジショニングマトリックス
- 主な発展
- 合併・買収
- 提携・協業
- 新製品の発売
- 拡大計画
第5章 市場推計・予測:技術別、2022-2035
- 主要動向
- レーザー選別機
- X線透過方式
- カラーベース
- 近赤外線
- LIBS技術
- その他(XRF、渦電流)
第6章 市場推計・予測:容量別、2022-2035
- 主要動向
- 低容量(150トン/時未満)
- 中容量(150~350トン/時)
- 高容量(350トン/時超)
第7章 市場推計・予測:用途別、2022-2035
- 主要動向
- 金属系
- 非金属
第8章 市場推計・予測:流通チャネル別、2022-2035
- 主要動向
- 直接販売
- 間接販売
第9章 市場推計・予測:地域別、2022-2035
- 主要動向
- 北米
- 米国
- カナダ
- 欧州
- ドイツ
- 英国
- フランス
- イタリア
- スペイン
- アジア太平洋地域
- 中国
- 日本
- インド
- オーストラリア
- 韓国
- ラテンアメリカ
- ブラジル
- メキシコ
- アルゼンチン
- 中東・アフリカ
- 南アフリカ
- サウジアラビア
- アラブ首長国連邦
第10章 企業プロファイル
- Binder+Co
- Buhler Group
- Comex
- Eriez Manufacturing
- FLSmidth
- HPY Sorting Technology
- Metso
- MineSense Technologies
- NextOre
- Pellenc ST
- REDWAVE
- Scantech
- Sesotec
- STEINERT
- TOMRA Systems

