
|
市場調査レポート
商品コード
1928934
焼却炉市場の機会、成長要因、業界動向分析、および2026年から2035年までの予測Incinerator Market Opportunity, Growth Drivers, Industry Trend Analysis, and Forecast 2026 - 2035 |
||||||
カスタマイズ可能
|
|||||||
| 焼却炉市場の機会、成長要因、業界動向分析、および2026年から2035年までの予測 |
|
出版日: 2026年01月12日
発行: Global Market Insights Inc.
ページ情報: 英文 135 Pages
納期: 2~3営業日
|

概要
世界の焼却炉市場は、2025年に186億米ドルと評価され、2035年までにCAGR 2.2%で成長し、233億米ドルに達すると予測されています。
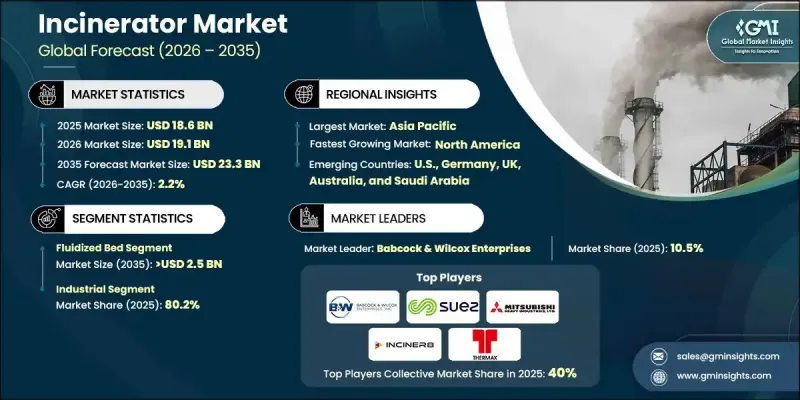
市場の発展は、世界的に増加する都市廃棄物の量と埋立地の利用可能性に対する圧力の高まりによって形作られています。公的・民間の廃棄物処理事業者は、長期的な廃棄物管理ニーズを支えるため、廃棄物量の削減、衛生的な処理、信頼性の高い処分能力を優先しています。焼却システムはエネルギー回収インフラとの統合が進み、厳格な排出規制を維持しながら廃棄物を利用可能な熱や電力に変換することが可能となっています。現代的な施設は、より高い処理能力、改善された熱効率、地域熱供給ネットワークとの互換性を備えて設計されています。収益の安定性は、処分料金、発電、熱供給契約、資源回収などによる収入源の多様化により向上しています。契約モデルは、原料の変動性や運用パフォーマンスをより適切に管理できるよう進化しています。同時に、環境目標がプラント設計に影響を与え、ライフサイクル排出量の削減、燃料代替、先進的な炭素管理ソリューションへの対応準備がより重視されています。これらの複合的な要因が着実な成長を支え、統合廃棄物管理フレームワークにおける焼却の役割を強化しています。
| 市場範囲 | |
|---|---|
| 開始年 | 2025年 |
| 予測年度 | 2026-2035 |
| 開始時価値 | 186億米ドル |
| 予測金額 | 233億米ドル |
| CAGR | 2.2% |
流動層焼却炉セグメントは、2035年までに25億米ドルに達すると予測されています。この技術は、安定した燃焼効率と均一な熱分布を実現できることから、需要が高まっています。これらのシステムは、熱性能の向上と排出量の削減が評価され、様々な廃棄物処理分野での採用が進んでいます。
産業用途セグメントは2025年に80.2%のシェアを占め、2035年までに180億米ドルに達すると予測されています。成長は、産業活動の拡大と有害廃棄物および非再生可能廃棄物の増加量によって牽引されています。産業事業者は、製品別の安全な取り扱いを確保すると同時に、現場でのエネルギー回収と統合廃棄物管理の実践を支援する、規制に準拠した廃棄物処理ソリューションへの投資を進めています。
米国焼却炉市場は2025年に90.7%のシェアを占め、39億米ドルの規模となりました。市場成長は、都市インフラ開発や近代化努力に沿った既存施設の更新および高容量システムの建設によって支えられています。
よくあるご質問
目次
第1章 調査手法と範囲
第2章 エグゼクティブサマリー
第3章 業界考察
- エコシステム分析
- 原材料の入手可能性と調達分析
- 製造能力評価
- サプライチェーンの回復力とリスク要因
- 流通ネットワーク分析
- 規制情勢
- 業界への影響要因
- 促進要因
- 業界の潜在的リスク&課題
- 成長可能性分析
- ポーターの分析
- 供給企業の交渉力
- 買い手の交渉力
- 新規参入業者の脅威
- 代替品の脅威
- PESTEL分析
- 焼却炉のコスト構造分析
- 新たな機会と動向
- デジタル化とIoT統合
- 投資分析と将来展望
第4章 競合情勢
- イントロダクション
- 企業の市場シェア分析:地域別
- 北米
- 欧州
- アジア太平洋地域
- 中東・アフリカ
- ラテンアメリカ
- 戦略的ダッシュボード
- Key partnerships &collaborations
- Major M&A activities
- Product innovations &launches
- Market expansion strategies
- 戦略的取り組み
- 競合ベンチマーキング
- イノベーションと技術動向
第5章 市場規模・予測:製品別、2022-2035
- ロータリーキルン
- 流動層
- 火格子
- 静止炉
- マルチプルハース
- その他
第6章 市場規模・予測:最終用途別、2022-2035
- 自治体向け
- 産業用
第7章 市場規模・予測:地域別、2022-2035
- 北米
- 米国
- カナダ
- 欧州
- 英国
- フランス
- ドイツ
- イタリア
- スウェーデン
- オランダ
- ロシア
- アジア太平洋地域
- 中国
- オーストラリア
- インド
- 日本
- 韓国
- 中東・アフリカ
- カタール
- アラブ首長国連邦
- ナイジェリア
- サウジアラビア
- 南アフリカ
- ラテンアメリカ
- ブラジル
- アルゼンチン
- メキシコ
第8章 企業プロファイル
- Alfa Therm
- Aswathi Industries
- Atlas Incinerators
- Babcock &Wilcox Enterprises
- CHUWASTAR
- Dutch Incinerators
- ECO Concepts
- For.Tec. Forniture Tecnologiche
- Haat Incinerator
- Igniss Energy
- Incinco
- Inciner8
- Keller Manufacturing
- KINC Mineral Technologies
- Maximus Envirotech
- MICROTEKNIK
- Mitsubishi Heavy Industries
- SUEZ
- Thermax
- Thermtech Industries
- Vikas Engineering
- Waste Spectrum

