
|
市場調査レポート
商品コード
1716627
網膜芽細胞腫治療市場の機会、成長促進要因、産業動向分析、2025年~2034年の予測Retinoblastoma Treatment Market Opportunity, Growth Drivers, Industry Trend Analysis, and Forecast 2025 - 2034 |
||||||
カスタマイズ可能
|
|||||||
| 網膜芽細胞腫治療市場の機会、成長促進要因、産業動向分析、2025年~2034年の予測 |
|
出版日: 2025年03月04日
発行: Global Market Insights Inc.
ページ情報: 英文 130 Pages
納期: 2~3営業日
|

全表示
- 概要
- 目次
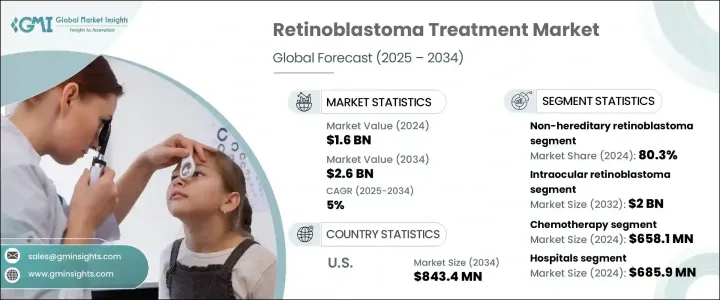
世界の網膜芽細胞腫治療市場は、2024年に16億米ドルと評価され、2025年から2034年にかけてCAGR 5%で成長すると予測されています。
この成長は主に、網膜芽細胞腫の発生率の上昇、標的療法の進歩の増加、眼腫瘍学における継続的な技術革新によってもたらされます。この稀ではあるが重篤な眼がんの有病率が小児の間で上昇する中、効果的な治療戦略の必要性はかつてないほど高まっています。研究機関や製薬会社は、副作用を最小限に抑えながら患者の予後を改善できる新規治療法の開発に積極的に投資しています。
世界中の政府やヘルスケア機関は、早期診断を促進するための啓発キャンペーンを開始し、生存率を大幅に向上させています。動脈内化学療法や硝子体内化学療法などの先進的な治療法が利用可能になったことで、網膜芽細胞腫の管理は大きく変化しています。遺伝子治療や精密医療などの新たな技術が、市場の楽観論をさらに後押ししています。さらに、眼科腫瘍学における人工知能の統合は、専門医が網膜芽細胞腫を早期に発見し、治療効果を向上させるのに役立っています。主要な病院やがんセンターが小児腫瘍科病棟を拡張しているため、網膜芽細胞腫の専門医療へのアクセスがより広まりつつあり、市場拡大に拍車をかけています。
| 市場範囲 | |
|---|---|
| 開始年 | 2024 |
| 予測年 | 2025-2034 |
| 開始金額 | 16億米ドル |
| 予測金額 | 26億米ドル |
| CAGR | 5% |
網膜芽細胞腫治療市場は、眼内網膜芽細胞腫と眼外網膜芽細胞腫に区分されます。眼内セグメントは、眼内網膜芽細胞腫の罹患率の上昇と革新的な治療法の採用増加により、2032年までに20億米ドルを創出すると予測されます。硝子体内および動脈内化学療法への嗜好の高まりは、従来の化学療法と比較して全身毒性の軽減に役立つため、この分野の成長に大きく寄与しています。患者やヘルスケアプロバイダーは、長期的な副作用を最小限に抑えながら有効性を向上させる治療法を積極的に求めており、これが市場の需要をさらに押し上げています。
最終用途別では、病院が網膜芽細胞腫治療市場を独占し、2024年には6億8,590万米ドルを創出します。病院が腫瘍学や小児眼科専門病棟に多額の投資を行っているため、眼科医、遺伝専門医、腫瘍学者からなる集学的チームが協力して標的治療アプローチを開発しています。化学療法センターが病院内に統合されたことで、治療へのアクセスが向上し、病院は網膜芽細胞腫管理の重要な担い手として位置付けられています。医療機関が最先端の技術と治療プロトコルを採用し続けていることから、病院部門は今後数年間にわたって持続的な成長を示すことになると思われます。
米国の網膜芽細胞腫治療市場は2024年に5億2,550万米ドルを生み出し、症例の増加は小児におけるRB1遺伝子変異の有病率の増加に起因しています。米国国立がん研究所と米国がん協会は、啓発キャンペーンを通じて早期発見イニシアチブを積極的に推進しており、これが高度な治療オプションの需要を加速しています。米国の主要ヘルスケアプロバイダーは、患者の転帰を改善するために、新規治療、臨床試験、小児腫瘍専門センターに投資しています。精密医療と標的治療アプローチの継続的な進歩により、米国は世界の網膜芽細胞腫治療市場において支配的な地位を維持すると予想されます。
目次
第1章 調査手法と調査範囲
第2章 エグゼクティブサマリー
第3章 業界洞察
- エコシステム分析
- 業界への影響要因
- 促進要因
- 網膜芽細胞腫の発生率の増加
- 網膜芽細胞腫の早期診断と治療
- 業界の潜在的リスク&課題
- 高い治療費
- 網膜芽細胞腫治療に伴う副作用
- 促進要因
- 成長可能性分析
- 規制状況
- 技術的展望
- 今後の市場動向
- ギャップ分析
- 特許分析
- パイプライン分析
- ポーター分析
- PESTEL分析
第4章 競合情勢
- イントロダクション
- 企業シェア分析
- 企業マトリックス分析
- 主要市場プレーヤーの競合分析
- 競合のポジショニングマトリックス
- 戦略ダッシュボード
第5章 市場推計・予測:疾患タイプ別、2021年~2034年
- 主要動向
- 非遺伝性網膜芽細胞腫
- 遺伝性網膜芽細胞腫
第6章 市場推計・予測:病期別、2021年~2034年
- 主要動向
- 眼内網膜芽細胞腫
- 眼外網膜芽細胞腫
第7章 市場推計・予測:治療タイプ別、2021年~2034年
- 主要動向
- 化学療法
- 放射線療法
- 外科療法
- レーザー療法
- 凍結療法
第8章 市場推計・予測:最終用途別、2021年~2034年
- 主要動向
- 病院
- がん治療センター
- 専門眼科クリニック
第9章 市場推計・予測:地域別、2021年~2034年
- 主要動向
- 北米
- 米国
- カナダ
- 欧州
- ドイツ
- 英国
- フランス
- スペイン
- イタリア
- オランダ
- アジア太平洋
- 中国
- 日本
- インド
- オーストラリア
- 韓国
- ラテンアメリカ
- ブラジル
- メキシコ
- アルゼンチン
- 中東・アフリカ
- 南アフリカ
- サウジアラビア
- アラブ首長国連邦
第10章 企業プロファイル
- Advancium Health
- Baxter International
- Bristol-Myers Squibb Company
- Cadila Pharmaceuticals
- Cellceutix Corporation
- GlaxoSmithKline
- Johnson &Johnson
- Merck &Co.
- Novartis
- Pfizer
- Teva Pharmaceutical Industries
- Theriva Biologics
The Global Retinoblastoma Treatment Market was valued at USD 1.6 billion in 2024 and is projected to grow at a CAGR of 5% between 2025 and 2034. This growth is primarily driven by the rising incidence of retinoblastoma, increasing advancements in targeted therapies, and continuous innovations in ocular oncology. With the prevalence of this rare but serious eye cancer rising among children, the need for effective treatment strategies has never been more critical. Research institutions and pharmaceutical companies are aggressively investing in the development of novel therapies that can enhance patient outcomes while minimizing adverse effects.
Governments and healthcare organizations worldwide are launching awareness campaigns to promote early diagnosis, significantly improving survival rates. The availability of advanced treatment modalities, including intra-arterial chemotherapy and intravitreal chemotherapy, is transforming the landscape of retinoblastoma management. Emerging technologies, such as gene therapy and precision medicine, are further driving optimism in the market. Additionally, the integration of artificial intelligence in ocular oncology is helping specialists detect retinoblastoma at earlier stages, improving treatment efficacy. With major hospitals and cancer centers expanding pediatric oncology units, access to specialized retinoblastoma care is becoming more widespread, fueling market expansion.
| Market Scope | |
|---|---|
| Start Year | 2024 |
| Forecast Year | 2025-2034 |
| Start Value | $1.6 Billion |
| Forecast Value | $2.6 Billion |
| CAGR | 5% |
The market for retinoblastoma treatment is segmented into intraocular and extraocular retinoblastoma. The intraocular segment is expected to generate USD 2 billion by 2032, driven by the rising incidence of intraocular retinoblastoma cases and the growing adoption of innovative treatment methods. The increasing preference for intravitreal and intra-arterial chemotherapy is significantly contributing to this segment's growth, as these methods help reduce systemic toxicity compared to traditional chemotherapy. Patients and healthcare providers are actively seeking treatment options that offer improved efficacy while minimizing long-term side effects, which is further propelling market demand.
In terms of end-use, hospitals dominated the retinoblastoma treatment market, generating USD 685.9 million in 2024. With hospitals making significant investments in oncology and specialized pediatric ophthalmology units, multidisciplinary teams comprising ophthalmologists, genetic specialists, and oncologists are collaborating to develop targeted treatment approaches. The integration of chemotherapy centers within hospital settings is enhancing treatment accessibility, positioning hospitals as key players in retinoblastoma management. As medical institutions continue to adopt cutting-edge technologies and treatment protocols, the hospital segment is set to witness sustained growth over the coming years.
U.S. retinoblastoma treatment market generated USD 525.5 million in 2024, with rising cases attributed to the increasing prevalence of RB1 gene mutations among children. The National Cancer Institute and the American Cancer Society are actively promoting early detection initiatives through awareness campaigns, which are accelerating the demand for advanced treatment options. Leading healthcare providers across the U.S. are investing in novel therapies, clinical trials, and specialized pediatric oncology centers to improve patient outcomes. With continued advancements in precision medicine and targeted treatment approaches, the U.S. is expected to remain a dominant player in the global retinoblastoma treatment market.
Table of Contents
Chapter 1 Methodology and Scope
- 1.1 Market scope and definitions
- 1.2 Research design
- 1.2.1 Research approach
- 1.2.2 Data collection methods
- 1.3 Base estimates and calculations
- 1.3.1 Base year calculation
- 1.3.2 Key trends for market estimation
- 1.4 Forecast model
- 1.5 Primary research and validation
- 1.5.1 Primary sources
- 1.5.2 Data mining sources
Chapter 2 Executive Summary
- 2.1 Industry 360° Synopsis
Chapter 3 Industry Insights
- 3.1 Industry ecosystem analysis
- 3.2 Industry impact forces
- 3.2.1 Growth drivers
- 3.2.1.1 Increasing incidence of retinoblastoma
- 3.2.1.2 Early diagnosis and treatment of retinoblastoma
- 3.2.2 Industry pitfalls and challenges
- 3.2.2.1 High treatment cost
- 3.2.2.2 Side effects associated with retinoblastoma treatment
- 3.2.1 Growth drivers
- 3.3 Growth potential analysis
- 3.4 Regulatory landscape
- 3.5 Technological landscape
- 3.6 Future market trends
- 3.7 Gap analysis
- 3.8 Patent analysis
- 3.9 Pipeline analysis
- 3.10 Porter's analysis
- 3.11 PESTEL analysis
Chapter 4 Competitive Landscape, 2024
- 4.1 Introduction
- 4.2 Company market share analysis
- 4.3 Company matrix analysis
- 4.4 Competitive analysis of major market players
- 4.5 Competitive positioning matrix
- 4.6 Strategy dashboard
Chapter 5 Market Estimates and Forecast, By Disease Type, 2021 – 2034 ($ Mn)
- 5.1 Key trends
- 5.2 Non-hereditary retinoblastoma
- 5.3 Hereditary retinoblastoma
Chapter 6 Market Estimates and Forecast, By Disease Stage, 2021 – 2034 ($ Mn)
- 6.1 Key trends
- 6.2 Intraocular retinoblastoma
- 6.3 Extraocular retinoblastoma
Chapter 7 Market Estimates and Forecast, By Treatment Type, 2021 – 2034 ($ Mn)
- 7.1 Key trends
- 7.2 Chemotherapy
- 7.3 Radiation therapy
- 7.4 Surgery
- 7.5 Laser therapy
- 7.6 Cryotherapy
Chapter 8 Market Estimates and Forecast, By End Use, 2021 – 2034 ($ Mn)
- 8.1 Key trends
- 8.2 Hospitals
- 8.3 Cancer treatment center
- 8.4 Specialty eye clinics
Chapter 9 Market Estimates and Forecast, By Region, 2021 – 2034 ($ Mn)
- 9.1 Key trends
- 9.2 North America
- 9.2.1 U.S.
- 9.2.2 Canada
- 9.3 Europe
- 9.3.1 Germany
- 9.3.2 UK
- 9.3.3 France
- 9.3.4 Spain
- 9.3.5 Italy
- 9.3.6 Netherlands
- 9.4 Asia Pacific
- 9.4.1 China
- 9.4.2 Japan
- 9.4.3 India
- 9.4.4 Australia
- 9.4.5 South Korea
- 9.5 Latin America
- 9.5.1 Brazil
- 9.5.2 Mexico
- 9.5.3 Argentina
- 9.6 Middle East and Africa
- 9.6.1 South Africa
- 9.6.2 Saudi Arabia
- 9.6.3 UAE
Chapter 10 Company Profiles
- 10.1 Advancium Health
- 10.2 Baxter International
- 10.3 Bristol-Myers Squibb Company
- 10.4 Cadila Pharmaceuticals
- 10.5 Cellceutix Corporation
- 10.6 GlaxoSmithKline
- 10.7 Johnson & Johnson
- 10.8 Merck & Co.
- 10.9 Novartis
- 10.10 Pfizer
- 10.11 Teva Pharmaceutical Industries
- 10.12 Theriva Biologics

