
|
市場調査レポート
商品コード
1667188
ハロイサイト市場の機会、成長促進要因、産業動向分析、2025~2034年の予測Halloysite Market Opportunity, Growth Drivers, Industry Trend Analysis, and Forecast 2025 - 2034 |
||||||
カスタマイズ可能
|
|||||||
| ハロイサイト市場の機会、成長促進要因、産業動向分析、2025~2034年の予測 |
|
出版日: 2024年12月19日
発行: Global Market Insights Inc.
ページ情報: 英文 235 Pages
納期: 2~3営業日
|

全表示
- 概要
- 目次
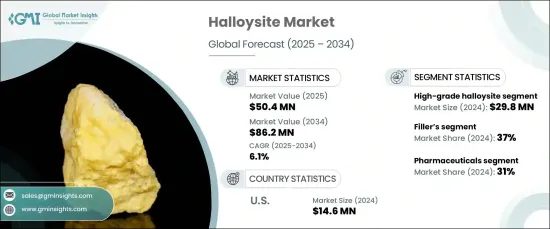
世界のハロイサイト市場は2024年に5,040万米ドルの評価額を達成し、2025年から2034年にかけてCAGR 6.1%で成長する見通しです。
この成長の原動力は、特徴的な管状構造を持つ天然由来の粘土鉱物であるハロイサイトの顕著な汎用性です。卓越した機械的強度、熱安定性、生体適合性で知られるハロイサイトは、セラミック、化粧品、塗料、コーティング、ポリマー複合材料など、多様な産業で好まれる材料となっています。そのユニークな特性は、高性能材料を必要とする分野での資産となっています。
製薬分野におけるドラッグデリバリーの制御や、パーソナルケア業界におけるスキンケア製品の添加剤など、先進的な用途におけるハロイサイトの採用が増加していることは、ハロイサイトの重要性が高まっていることを裏付けています。製品の性能と効能を高めるハロイサイトの能力は、特に業界が進化する消費者ニーズを満たす革新的なソリューションを求める中、需要を牽引し続けています。産業界がプロセスを最適化するために環境に優しい多機能コンポーネントを探求しているため、材料の持続可能性と効率性への注目が高まっていることも、ハロイサイトの魅力と一致しています。このような用途の拡大は、ハロイサイトが重要な役割を果たすナノテクノロジーの進歩によってさらに裏付けられています。
| 市場範囲 | |
|---|---|
| 開始年 | 2024 |
| 予測年 | 2025-2034 |
| 開始金額 | 5,040万米ドル |
| 予測金額 | 8,620万米ドル |
| CAGR | 6.1% |
市場はグレード別に高品位ハロイサイトと低品位ハロイサイトに区分されます。高品位ハロイサイトは、2024年の評価額2,980万米ドルで市場の大部分を占めています。このセグメントは、ナノテクノロジーやセラミックなどの特殊産業で堅調な需要があり、優れた純度と性能向上特性が不可欠です。研究開発の継続的な重点化は、高品位ハロイサイトの新たな可能性を解き放ち続け、最先端の産業用途における貴重な資源としての地位を強化しています。
用途別に見ると、ハロイサイト市場にはナノチューブ、触媒、フィラー、セラミック体、その他が含まれます。このうち、フィラー部門は2024年に最大規模に浮上し、市場シェアの37%を占めています。優れた接着能力と耐高温性で珍重されるアクリル系およびシリコン系接着剤の需要増が、このセグメントの主な促進要因です。環境に優しい接着剤へのシフトは、特に持続可能で高性能なソリューションが強く求められている自動車産業やエレクトロニクス産業で牽引力を増しています。
米国では、ハロイサイト市場は2024年に1,460万米ドルの評価額に達しました。成長の原動力は、建設、化粧品、医薬品などの分野における先端材料へのニーズの高まりです。ナノテクノロジー、環境修復、軽量複合材におけるハロイサイトの役割は、特に自動車や航空宇宙における持続可能性と効率性の動向に合わせる上で重要な要素となっています。研究開発への投資と大手メーカーの存在が、この地域における市場の見通しを引き続き強化しています。
目次
第1章 調査手法と調査範囲
- 市場範囲と定義
- 基本推定と計算
- 予測計算
- データソース
- 1次データ
- 2次データ
- 有料情報源
- 公的情報源
第2章 エグゼクティブサマリー
第3章 業界洞察
- エコシステム分析
- バリューチェーンに影響を与える要因
- 利益率分析
- 破壊
- 将来の展望
- メーカー
- 流通業者
- サプライヤーの状況
- 利益率分析
- 主要ニュースと取り組み
- 規制状況
- 影響要因
- 促進要因
- セラミック産業におけるハロイサイトの需要拡大
- ドラッグデリバリーシステムの製薬用途におけるハロイサイトの使用の増加
- ポリマー複合材料における用途の拡大、機械的・熱的特性の向上
- 業界の潜在的リスク&課題
- 原料価格の変動
- ハロイサイトのサプライチェーンと入手可能性に影響を与える地政学的要因
- 促進要因
- 成長可能性分析
- ポーターの分析
- PESTEL分析
第4章 競合情勢
- イントロダクション
- 企業シェア分析
- 競合のポジショニング・マトリックス
- 戦略展望マトリックス
第5章 市場推計・予測:グレード別、2021年~2034年
- 主要動向
- 高級ハロイサイト
- 低級ハロイサイト
第6章 市場推計・予測:用途別、2021年~2034年
- 主要動向
- ナノチューブ
- 触媒
- フィラー
- セラミックボディ
- その他(パーソナルケアと化粧品、コーティングと塗料)
第7章 市場推計・予測:最終用途産業別、2021年~2034年
- 主要動向
- 塗料・コーティング
- 化粧品
- 医薬品
- セラミック
- その他(建設、農業)
第8章 市場推計・予測:地域別、2021年~2034年
- 主要動向
- 北米
- 米国
- カナダ
- 欧州
- 英国
- ドイツ
- フランス
- イタリア
- スペイン
- ロシア
- アジア太平洋
- 中国
- インド
- 日本
- 韓国
- オーストラリア
- ラテンアメリカ
- ブラジル
- メキシコ
- 中東・アフリカ
- 南アフリカ
- サウジアラビア
- アラブ首長国連邦
第9章 企業プロファイル
- Active Minerals International
- Applied Minerals
- Ashapura Group of Industries
- BASF SE
- English Indian Clays
- Global Industrial Solutions
- Halloysite
- Imerys Ceramics
- I-Minerals
- KaMin
- KeraSolutions
- LB MINERALS
- SCR-Sibelco
- Thiele Kaolin Company
- Una Kaolin
The Global Halloysite Market achieved a valuation of USD 50.4 million in 2024 and is poised to grow at a CAGR of 6.1% from 2025 to 2034. This growth is driven by the remarkable versatility of halloysite, a naturally occurring clay mineral with a distinctive tubular structure. Known for its exceptional mechanical strength, thermal stability, and biocompatibility, halloysite has become a preferred material across diverse industries, including ceramics, cosmetics, paints, coatings, and polymer composites. Its unique characteristics make it an asset in sectors that demand high-performance materials.
The rising adoption of halloysite in advanced applications, such as controlled drug delivery in the pharmaceutical sector and as an additive in skincare products in the personal care industry, underscores its growing relevance. Halloysite's ability to enhance the performance and efficacy of products continues to drive demand, especially as industries seek innovative solutions to meet evolving consumer needs. The increasing focus on sustainability and efficiency in materials also aligns with halloysite's appeal, as industries explore environmentally friendly and multifunctional components to optimize their processes. This expanding scope of applications is further supported by advancements in nanotechnology, where halloysite plays a critical role.
| Market Scope | |
|---|---|
| Start Year | 2024 |
| Forecast Year | 2025-2034 |
| Start Value | $50.4 Million |
| Forecast Value | $86.2 Million |
| CAGR | 6.1% |
The market is segmented by grade into high-grade and low-grade halloysite. High-grade halloysite accounted for a significant portion of the market in 2024, with a valuation of USD 29.8 million. This segment is experiencing robust demand in specialized industries like nanotechnology and ceramics, where its superior purity and performance-enhancing attributes are indispensable. The ongoing emphasis on research and development continues to unlock new possibilities for high-grade halloysite, reinforcing its position as a valuable resource in cutting-edge industrial applications.
By application, the halloysite market encompasses nanotubes, catalysts, fillers, ceramic bodies, and others. Among these, the fillers segment emerged as the largest in 2024, commanding 37% of the market share. The increasing demand for acrylic and silicon-based adhesives, prized for their superior bonding capabilities and high-temperature resistance, is a primary driver of this segment. The shift toward eco-friendly adhesives is gaining traction, particularly in the automotive and electronics industries, where sustainable and high-performance solutions are highly sought after.
In the United States, the halloysite market reached a valuation of USD 14.6 million in 2024. The growth is fueled by a rising need for advanced materials in sectors such as construction, cosmetics, and pharmaceuticals. Halloysite's role in nanotechnology, environmental remediation, and lightweight composites makes it a critical component in aligning with trends toward sustainability and efficiency, particularly in automotive and aerospace. Investment in research and development, alongside the presence of major manufacturers, continues to strengthen the market's outlook in the region.
Table of Contents
Chapter 1 Methodology & Scope
- 1.1 Market scope & definitions
- 1.2 Base estimates & calculations
- 1.3 Forecast calculations
- 1.4 Data sources
- 1.4.1 Primary
- 1.4.2 Secondary
- 1.4.2.1 Paid sources
- 1.4.2.2 Public sources
Chapter 2 Executive Summary
- 2.1 Industry synopsis, 2021-2034
Chapter 3 Industry Insights
- 3.1 Industry ecosystem analysis
- 3.1.1 Factor affecting the value chain
- 3.1.2 Profit margin analysis
- 3.1.3 Disruptions
- 3.1.4 Future outlook
- 3.1.5 Manufacturers
- 3.1.6 Distributors
- 3.2 Supplier landscape
- 3.3 Profit margin analysis
- 3.4 Key news & initiatives
- 3.5 Regulatory landscape
- 3.6 Impact forces
- 3.6.1 Growth drivers
- 3.6.1.1 Growing demand for halloysite in the ceramics industry
- 3.6.1.2 Increasing use of halloysite in pharmaceutical applications for drug delivery systems
- 3.6.1.3 Expansion of applications in polymer composites, enhancing mechanical and thermal properties
- 3.6.2 Industry pitfalls & challenges
- 3.6.2.1 Price volatility of raw material
- 3.6.2.2 Geopolitical factors impacting the supply chain and availability of halloysites
- 3.6.1 Growth drivers
- 3.7 Growth potential analysis
- 3.8 Porter’s analysis
- 3.9 PESTEL analysis
Chapter 4 Competitive Landscape, 2024
- 4.1 Introduction
- 4.2 Company market share analysis
- 4.3 Competitive positioning matrix
- 4.4 Strategic outlook matrix
Chapter 5 Market Estimates & Forecast, By Grade, 2021-2034 (USD Million) (Kilo Tons)
- 5.1 Key trends
- 5.2 High-grade halloysite
- 5.3 Low-grade halloysite
Chapter 6 Market Estimates & Forecast, By Application, 2021-2034 (USD Million) (Kilo Tons)
- 6.1 Key trends
- 6.2 Nanotubes
- 6.3 Catalysts
- 6.4 Fillers
- 6.5 Ceramic bodies
- 6.6 Others (personal care and cosmetics, coatings and paints)
Chapter 7 Market Estimates & Forecast, By End Use Industry, 2021-2034 (USD Million) (Kilo Tons)
- 7.1 Key trends
- 7.2 Paints & coatings
- 7.3 Cosmetics
- 7.4 Pharmaceuticals
- 7.5 Ceramic
- 7.6 Others (construction, agriculture)
Chapter 8 Market Estimates & Forecast, By Region, 2021-2034 (USD Million) (Kilo Tons)
- 8.1 Key trends
- 8.2 North America
- 8.2.1 U.S.
- 8.2.2 Canada
- 8.3 Europe
- 8.3.1 UK
- 8.3.2 Germany
- 8.3.3 France
- 8.3.4 Italy
- 8.3.5 Spain
- 8.3.6 Russia
- 8.4 Asia Pacific
- 8.4.1 China
- 8.4.2 India
- 8.4.3 Japan
- 8.4.4 South Korea
- 8.4.5 Australia
- 8.5 Latin America
- 8.5.1 Brazil
- 8.5.2 Mexico
- 8.6 MEA
- 8.6.1 South Africa
- 8.6.2 Saudi Arabia
- 8.6.3 UAE
Chapter 9 Company Profiles
- 9.1 Active Minerals International
- 9.2 Applied Minerals
- 9.3 Ashapura Group of Industries
- 9.4 BASF SE
- 9.5 English Indian Clays
- 9.6 Global Industrial Solutions
- 9.7 Halloysite
- 9.8 Imerys Ceramics
- 9.9 I-Minerals
- 9.10 KaMin
- 9.11 KeraSolutions
- 9.12 LB MINERALS
- 9.13 SCR-Sibelco
- 9.14 Thiele Kaolin Company
- 9.15 Una Kaolin

