
|
市場調査レポート
商品コード
1685153
巻線型変流器市場の機会、成長促進要因、産業動向分析、2025年~2034年の予測Wound Type Current Transformer Market Opportunity, Growth Drivers, Industry Trend Analysis, and Forecast 2025 - 2034 |
||||||
カスタマイズ可能
|
|||||||
| 巻線型変流器市場の機会、成長促進要因、産業動向分析、2025年~2034年の予測 |
|
出版日: 2025年01月03日
発行: Global Market Insights Inc.
ページ情報: 英文 110 Pages
納期: 2~3営業日
|

全表示
- 概要
- 目次
巻線型変流器の世界市場は、2024年には10億米ドルに達し、2025年から2034年にかけてCAGR 5.9%で成長すると予測されています。
この着実な成長は主に、電力インフラの継続的な進歩とともに、世界のエネルギー需要の増加によってもたらされます。巻線タイプの変流器は、正確な電流測定とシステム保護に重要な役割を果たすため、公益事業や産業用アプリケーションに不可欠です。世界のエネルギー消費量が増加し、これらの需要に対応するためにインフラが進化するにつれて、巻線型変流器は現代の電力システムの重要な構成要素になりつつあります。
スマートグリッドや再生可能エネルギー技術の採用が拡大していることも、市場を前進させる重要な要因です。世界各国の政府は、送電網インフラの近代化とエネルギー効率の高いシステムの導入に注力しています。この動向は、持続可能で信頼性の高いエネルギーシステムへの世界のシフトに合致し、これらの変圧器の展開に有利な環境を作り出しています。さらに、エネルギー効率を高め、二酸化炭素排出量を削減するための継続的な取り組みが、さまざまな分野での変圧器の普及に影響を与えています。
| 市場範囲 | |
|---|---|
| 開始年 | 2024 |
| 予測年 | 2025-2034 |
| 開始金額 | 10億米ドル |
| 予測金額 | 18億米ドル |
| CAGR | 5.9% |
技術の進歩が巻線型変流器市場を再構築しています。材料、設計、機能の革新により、優れた絶縁性、コンパクトな設計、熱管理の強化を実現した最新の変圧器が開発されています。こうした改良により、スペースに制約のある環境やエネルギー集約型の用途での使用に理想的なものとなっています。さらに、電力セクターにおけるデジタル技術の台頭は、リアルタイムの監視とデータ分析を可能にするスマート変圧器への道を開いた。こうしたインテリジェント・システムは、機能性を高めるだけでなく、電力ネットワークの保護と効率をより高いレベルで保証します。
乾式変圧器部門は、信頼性と低メンテナンスコストという評判により、2034年までに4億5,320万米ドルの売上が見込まれています。これらの変圧器は、特に産業・商業部門において、屋内・屋外両方の用途でますます好まれています。環境に優しい特性と安全性が、さまざまな場面での人気の高まりに寄与しています。一方、配電分野は2034年までCAGR 5.1%で成長すると予測されています。この成長の原動力となっているのは、電力需要の増加に対応するため、配電網の近代化に向けた投資が増加していることです。都市化と工業化が進むにつれて、効率的で信頼性の高い配電システムの必要性はますます高まっており、巻線変流器は運転効率と故障保護を維持する上で重要な役割を果たしています。
米国では、巻線型変流器市場は2034年までに1億4,560万米ドルに達すると予想されています。米国の成長の主な原動力には、老朽化した送電網インフラを改善し、再生可能エネルギー源を電力ミックスに統合する取り組みが含まれます。さらに、同国はスマートグリッド技術とエネルギー効率化対策に多額の投資を行っています。こうした取り組みにより、産業部門と公益事業部門の両方で、監視や保護などの用途に巻線型変流器の採用が加速しています。高電圧システムにおける正確な電流測定と故障検出のニーズが高まる中、巻線型変流器の需要は今後も堅調に推移すると予測されます。
目次
第1章 調査手法と調査範囲
- 市場の定義
- 基本推定と計算
- 予測計算
- データソース
第2章 エグゼクティブサマリー
第3章 業界洞察
- エコシステム分析
- 規制状況
- 業界への影響要因
- 促進要因
- 業界の潜在的リスク&課題
- 成長ポテンシャル分析
- ポーター分析
- PESTEL分析
第4章 競合情勢
- 戦略ダッシュボード
- イノベーションと持続可能性の展望
第5章 市場規模・予測:冷却材別、2021年~2034年
- 主要動向
- ドライタイプ
- 油浸式
第6章 市場規模・予測:定格電圧別、2021年~2034年
- 主要動向
- 33 kV以下
- 33 kV~66 kV
- 66 kV以上
第7章 市場規模・予測:用途別、2021~2034年
- 主要動向
- 配電
- 製造
- その他
第8章 市場規模・予測:地域別、2021年~2034年
- 主要動向
- 北米
- 米国
- カナダ
- メキシコ
- 欧州
- 英国
- フランス
- ドイツ
- イタリア
- ロシア
- スペイン
- アジア太平洋
- 中国
- オーストラリア
- インド
- 日本
- 韓国
- 中東・アフリカ
- サウジアラビア
- アラブ首長国連邦
- 南アフリカ
- ラテンアメリカ
- ブラジル
- アルゼンチン
第9章 企業プロファイル
- ABB
- Amran
- ARTECHE
- Automatic Electric
- Dalian Huayi Electric Power Electric Appliances
- General Electric
- Guangdong Sihui Instrument Transformer Works
- Hitachi Energy
- Instrument Transformers
- Macroplast
- Peak Demand
- Siemens Energy
- TWB
- Wenzhou Unisun Electric
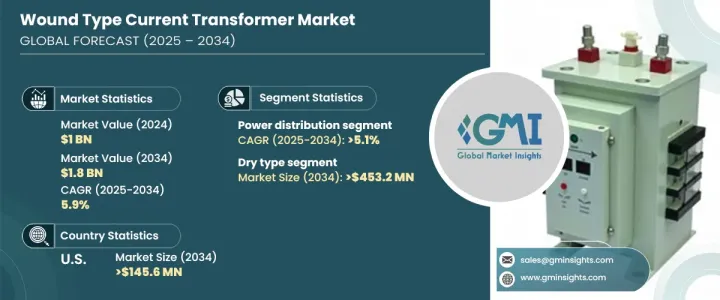
The Global Wound Type Current Transformer Market is expected to reach USD 1 billion in 2024 and is set to grow at a CAGR of 5.9% from 2025 to 2034. This steady growth is primarily driven by the increasing global demand for energy, along with ongoing advancements in power infrastructure. Wound-type current transformers play a crucial role in providing precise current measurement and system protection, which makes them indispensable in utility and industrial applications. As global energy consumption rises and infrastructure evolves to meet these demands, wound-type current transformers are becoming key components of modern power systems.
The growing adoption of smart grids and renewable energy technologies is another significant factor propelling the market forward. Governments worldwide are focusing on modernizing grid infrastructure and implementing energy-efficient systems. This trend creates a favorable environment for the deployment of these transformers, aligning with the global shift toward sustainable and reliable energy systems. Additionally, ongoing efforts to increase energy efficiency and reduce carbon footprints are influencing the widespread use of these transformers in various sectors.
| Market Scope | |
|---|---|
| Start Year | 2024 |
| Forecast Year | 2025-2034 |
| Start Value | $1 Billion |
| Forecast Value | $1.8 Billion |
| CAGR | 5.9% |
Technological advancements are reshaping the wound-type current transformer market. Innovations in materials, design, and functionality have led to the development of modern transformers that offer superior insulation, compact designs, and enhanced thermal management. These improvements make them ideal for use in space-constrained environments and energy-intensive applications. Furthermore, the rise of digital technologies in the power sector has paved the way for smart transformers, which enable real-time monitoring and data analysis. These intelligent systems not only provide enhanced functionality but also ensure a higher level of protection and efficiency for power networks.
The dry-type transformer segment is expected to generate USD 453.2 million by 2034, driven by its reputation for reliability and low maintenance costs. These transformers are increasingly favored for both indoor and outdoor applications, particularly in industrial and commercial sectors. Their eco-friendly properties and safety features contribute to their growing popularity in a variety of settings. On the other hand, the power distribution segment is projected to grow at a CAGR of 5.1% through 2034. This growth is fueled by increased investments in modernizing power distribution networks to keep pace with rising electricity demand. As urbanization and industrialization continue, the need for efficient and reliable power distribution systems becomes more pressing, with wound-type current transformers playing a vital role in maintaining operational efficiency and fault protection.
In the U.S., the wound-type current transformer market is expected to reach USD 145.6 million by 2034. The primary drivers of growth in the U.S. include efforts to upgrade aging grid infrastructure and integrate renewable energy sources into the power mix. Additionally, the country is making substantial investments in smart grid technologies and energy efficiency measures. These efforts are accelerating the adoption of wound-type current transformers for applications such as monitoring and protection in both industrial and utility sectors. With a growing need for accurate current measurement and fault detection in high-voltage systems, the demand for these transformers is projected to remain strong.
Table of Contents
Chapter 1 Methodology & Scope
- 1.1 Market definitions
- 1.2 Base estimates & calculations
- 1.3 Forecast calculation
- 1.4 Data sources
- 1.4.1 Primary
- 1.4.2 Secondary
- 1.4.2.1 Paid
- 1.4.2.2 Public
Chapter 2 Executive Summary
- 2.1 Industry synopsis, 2021 – 2034
Chapter 3 Industry Insights
- 3.1 Industry ecosystem analysis
- 3.2 Regulatory landscape
- 3.3 Industry impact forces
- 3.3.1 Growth drivers
- 3.3.2 Industry pitfalls & challenges
- 3.4 Growth potential analysis
- 3.5 Porter's analysis
- 3.5.1 Bargaining power of suppliers
- 3.5.2 Bargaining power of buyers
- 3.5.3 Threat of new entrants
- 3.5.4 Threat of substitutes
- 3.6 PESTEL analysis
Chapter 4 Competitive landscape, 2024
- 4.1 Strategic dashboard
- 4.2 Innovation & sustainability landscape
Chapter 5 Market Size and Forecast, By Cooling, 2021 – 2034 (‘000 Units & USD Million)
- 5.1 Key trends
- 5.2 Dry type
- 5.3 Oil immersed
Chapter 6 Market Size and Forecast, By Voltage Rating, 2021 – 2034 (‘000 Units & USD Million)
- 6.1 Key trends
- 6.2 ≤ 33 kV
- 6.3 > 33 kV to ≤ 66 kV
- 6.4 > 66 kV
Chapter 7 Market Size and Forecast, By Application, 2021 – 2034 (‘000 Units & USD Million)
- 7.1 Key trends
- 7.2 Power distribution
- 7.3 Manufacturing
- 7.4 Others
Chapter 8 Market Size and Forecast, By Region, 2021 – 2034 (‘000 Units & USD Million)
- 8.1 Key trends
- 8.2 North America
- 8.2.1 U.S.
- 8.2.2 Canada
- 8.2.3 Mexico
- 8.3 Europe
- 8.3.1 UK
- 8.3.2 France
- 8.3.3 Germany
- 8.3.4 Italy
- 8.3.5 Russia
- 8.3.6 Spain
- 8.4 Asia Pacific
- 8.4.1 China
- 8.4.2 Australia
- 8.4.3 India
- 8.4.4 Japan
- 8.4.5 South Korea
- 8.5 Middle East & Africa
- 8.5.1 Saudi Arabia
- 8.5.2 UAE
- 8.5.3 South Africa
- 8.6 Latin America
- 8.6.1 Brazil
- 8.6.2 Argentina
Chapter 9 Company Profiles
- 9.1 ABB
- 9.2 Amran
- 9.3 ARTECHE
- 9.4 Automatic Electric
- 9.5 Dalian Huayi Electric Power Electric Appliances
- 9.6 General Electric
- 9.7 Guangdong Sihui Instrument Transformer Works
- 9.8 Hitachi Energy
- 9.9 Instrument Transformers
- 9.10 Macroplast
- 9.11 Peak Demand
- 9.12 Siemens Energy
- 9.13 TWB
- 9.14 Wenzhou Unisun Electric

